Monday, May 31, 2010

Contemporary Art Of Bull Trend ...

Highly rated technical analysts headed by Achim Matzke at Commerzbank painted the technical picture last week:
Against the backdrop of the medium-term overbought situation, the index has recently left the bull market trend with a take-profit signal and has also broken through the still-rising 200-day m.a. on its way down. As the slump in price is already over 10%, this is a correction in the technical sense, the first in this bull market cycle. The correction is limited on the one hand by the support at c. 1,045 points and on the other by the staggered resistance zone at 1,200-1,250. A trading market should emerge within this price range in the coming weeks. Only when the S&P 500 falls below the zone at c. 1,045 should further, medium-term technical clouding be expected.
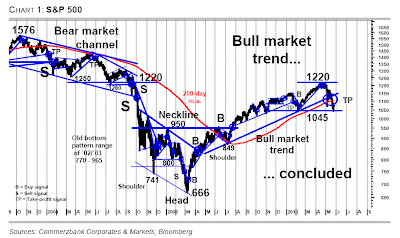
Click on chart to enlarge, courtesy of Commerzbank.
Global strategists at Nomura are "pressing" on the sentiment and "improving fundamentals" over the weekend, what they summarize as follows:

We think the past two weeks have seen capitulation by equity investors as sentiment reached a historical low.

The past two weeks saw net outflows of US$24bn from global equity mutual funds – the second-largest weekly outflow over the history of our series.

Put-call ratios are at levels close to those reached in September 2008, reflecting extremely depressed sentiment.

Surveys of sentiment like the Investors Intelligence survey and the AAII bull-bear
survey also portray bearish sentiment, though not to the same extremes.

We think depressed sentiment should be another supportive factor for equities, apart from improving fundamentals.

Sentiment is more depressed in Europe than in the US, which is not surprising. However, we think the sell-off in Continental Europe is overdone and recommend overweighting the market relative to the US.

We believe investors are not paying sufficient attention to the improving fundamentals, with attractive relative valuations and better earnings prospects because of the lower euro.

Though, Christopher Wood at CLSA Asia-Pacific Markets was less enthusiastic last Thursday:

But GREED & fear’s view is that the risk trade, for now, is more likely to remain off rather than on. That suggests a posture of selling rallies rather than buying dips.
Click on chart to enlarge, courtesy of CLSA Asia-Pacific Markets.


So, selling the rallies?

Friday, May 28, 2010

Cannot Get Eyes Off The Spanish Sovereign Spread

Despite the rally in risk assets in the last couple of days, and the QE by ECB ... my eyes "watch the strength" of Spanish sovereign spread. Click on chart below, Spanish 5 year benchmark bond over Germany, data courtesy of Reuters.

Jim Reid, the strategist at Deutsche Bank, explains today:

... but if we only had to look at one thing we'd probably keep it simple and look at peripheral Sovereign spreads. The reason for this is that this is the market we have to stabilise before we can put this stage of what will be an ongoing crisis to bed.

It must be disappointing to both the market and the authorities that 5yr peripheral CDS spreads for example are now pretty much at identical levels to where they were around the time of the Trillion Dollar bail-out package 3 weeks ago. One could actually be concerned that Spain and Italy are around 30-40bps wider than where they were on the Monday morning immediately following the bail-out. So a Trillion Dollar commitment plus ECB buying has yet to make a lasting impact on the epicentre of this crisis. We think it eventually will as the political commitment is extraordinary. However until we see clear signs that the free market wants to buy peripheral debt then the risk is that the package and the European resolve is tested one more time. This would likely bring a fresh bout of market volatility.

Our interpretation of current events is that they are similar to those seen in the corporate credit market back in Autumn 2008. Back then corporate credit became absurdly cheap due to the dramatic collapse of leveraged positions (SIVs being a huge factor). However the market needed several months of these very wide spreads to locate new unlevered buyers to replace the old leveraged buyers. Peripheral Debt today is similar. We need to find investors to take place of those Government bond investors who have now decided that their job is to take interest rate risk and not credit risk. So unless the free market makes this transition quickly, the authorities may soon be forced into more aggressive action. So for us Sovereign spreads are still at the epicentre. Everything else is highly dependant and will respond to this.


Going to search for investors ...

Wednesday, May 26, 2010

Pearls Of Investment Lectures By Benjamin Graham

Thanks to Jason Zweig, read the probably best investment lecture ever here ...

James Montier About To Kill "Cream Lickers" At Efficient Frontiers?

James Montier, the well known expert of behavioural finance and an advocate of value investing, the member of GMO's asset allocation team now, has an excellent "white paper" (available at GMO, registration necessary) "I Want to Break Free, or, Strategic Asset Allocation ≠ Static Asset Allocation".

This paragraph, written by James, may be applicable to the situation in the markets these days, if one believes that equities may lead over credit for a longer time:
Volatility creates opportunity, not risk. As John Maynard Keynes long ago opined, “It is largely the fluctuations which throw up the bargains and the uncertainty due to fluctuations which prevents other people from taking advantage of them.”
However, the flaws of modern portfolio theory are clearly exposed. It should not be difficult to identify the "cream lickers" at efficient frontiers, who fail to handle the reality... Click on chart to enlarge, courtesy of GMO.

Enjoy the note in full!

Tuesday, May 25, 2010

Gaming The Game Theory

William Spaniel has got an excellent compilation of game theory videos on YouTube (H/T FT Alphaville).

Inter-Bank Love

Velocity of money drops very rapidly, if banks do not love each other ... as some parents in form of sovereigns cannot help anymore to solve the dispute.

Click on charts to enlarge, courtesy of Nordea Markets.

Monday, May 24, 2010

Obvious Duty To Report On Klarman

Assuming the warning on this blog at the upper left corner using the words of Seth Klarman, pushes me for an obvious duty to report on the rare appearance in media. There are 3 sentence to quote from Reuters contribution:

"Given the recent run-up, I'd be worried that we'll have another 10 years of zero returns," Klarman, who rarely speaks in public, said at the CFA Institute's annual conference in Boston.

Current market conditions remind Klarman of a Hostess Twinkie snack cake because "everything is being manipulated by the government" and appears "artificial."

"I'm more worried about the world broadly than I've ever been in my whole career," Klarman said.


Here are more links to media appearance:
WSJ: Legendary Investor Is More Worried Than Ever
and more at market folly: Notes From Seth Klarman's CFA Conference Speech

J.P.Morgan Maintains Medium-Term Bullish View On Risky Assets, But Keeps Tactical Risk Low

Here is the latest summary of J.P.Morgan's markets view:
• Asset allocation: Keeping risk tight, we’re avoiding consensus trades where feasible, but not giving up on medium-term bullish view on risky assets.
• Economics: Slightly softer data may unnerve markets but are not enough to change our growth forecasts.
• Fixed income: Bond yields to move higher medium term, but remain hostage to market volatility near term.
• Equities: Position squaring favors Europe, large versus small caps, and defensive versus cyclical sectors in the near term.
• Credit: Flows out of high yield mutual funds have been occurring for three consecutive weeks, pointing to further spread widening near term.
FX: The recovery in commodity currencies looks to be on hold until after G-20.
• Commodities: The medium-term direction is still positive.

Guys at J.P.Morgan have made also a great Q&A session, with some most relevant, in my opinion, questions and answers as follows:

How bad can it get? If we are right that the underlying cyclical rebound remains in place, that banks will not be a source of contagion, and that policymakers will be generally supportive, then risky markets should bottom over the next month or so. But this argument does not tell us how far the knife can fall.

What will stop the sell-off? Three signals are most important: (1) confirmation that the nonfinancial sector—companies and households—are not panicking and remain in expansion mode; (2) coordination among policymakers to support markets rather than punish them; and (3) markets cease reacting to bad news and start reacting to good news, something that was clearly not present this week. One can understand the frustration of policymakers in the midst of renewed market panic, but the only solution for overstretched public balance sheets is growth, and that requires coordinated support to markets.

What to do in the meanwhile? Keeping tactical risk low is obvious. Investors with staying power should start buying oversold assets, though, without being in a hurry. Remaining positions should be focused on non-consensus exposures.

Then, there is a belief that employment will follow the corporate profit growth, as can be seen in the chart below. However, the gap has got extremely large this time, and the question for me is - whether the one is achieved at the expense of other ... and whether this is not exactly the cause of weakness in economy?

Click on chart to enlarge, courtesy of J.P.Morgan.

How long the cyclical upturn remains in place?

Friday, May 21, 2010

China Car Sales Versus Residential Floor Space Sold

While we observe sharp declines in sales of Chinese residential floor space, Citigroup suggests that we should also see the same in car sales?

Click on chart to enlarge, courtesy of Citigroup Global Markets.

Thursday, May 20, 2010

Baltic Dry Index

As Barclays Capital was pointing at on Tuesday, not all signals are bearish. Or, at least, it appears so far...

Click on chart to enlarge, courtesy of Barclays.


Wednesday, May 19, 2010

Twin Deficits

Mizuho has exactly, as upon request, a nice chart for us with Twin Deficits today, my emphasis (eclipse). Click to enlarge.


Fear And Fundamentals

The title is stolen from the latest note by most bullish strategist on the Street, but I will return to it after a jump. However, let's look at fascinating sentence, in my humble opinion, delivered by the guys at GaveKal today:
We remain buyers of equities on the medium-term, but we fear that the current macro headwinds will dominate the fundamentally sound micro environment, at least until we have more clarity in Europe.

Who ever thought that macro headwinds are caused by delusion of fundamentally sound micro environment? Is this the mind-trap of "cream lickers" at efficient frontiers, who forget that in the real life debt markets are at least 2 times bigger than equity markets? Well, let it be ... but it appears I am not alone in thinking on private sector stability.

Now, back to Binky Chadha and the team at Deutsche Bank. The latest message from yesterday in a short summary:

The tension between improving US economic and corporate fundamentals versus first sovereign credit then economic slowdown fears in Europe has buffeted equities recently. In our view:

(i) Fundamentals: the sales-production gap is only a third of the way through correcting and will continue to drive the US recovery; high cash flows and balances are supportive of corporate spend and equities; as is investor positioning;

(ii) Fear: direct earnings impacts of slower Euro area growth and euro depreciation are limited; more important contagion source is spillovers from interbank markets where spreads have widened but in the US only to their pre-crisis average level;

(iii) Too much fear in the price: the market is pricing in too high a probability (37%- 48%) of the worst-case scenario; we think it is much smaller (less than 10%);

(iv) Near trough multiple: the trough multiple of 13x NTM EPS (S&P 500 1100) has held in the last 3 corrections and should continue to hold in a baseline of US recovery;

(v) More up than downside: history suggests following an 8-10% correction the upside potential (9-15%) is significantly larger and higher probability than the downside;

(vi) Strategy: the turn in the labor market, growing regional divergence and dollar appreciation reinforce our calls to overweight the US, Discretionary and Financials, underweight Energy and Materials; and domestic over foreign exposure in stocks.


Click on chart to enlarge, courtesy of Deutsche Bank.


I have been looking at issues around the US consumer, but the production gap maybe is explained by the uncompetitiveness of US economy? Think of Twin Deficits?

Tuesday, May 18, 2010

China Investment Madness

Stunning charts from CLSA's 15th China Forum in Shanghai ... click on charts to enlarge, courtesy of CLSA Asia-Pacific Markets.


So, if you do not know how to grow - just invest! At least in China ...

Merrill Sees Buy Signal Close

Bank of America Merrill Lynch is out with monthly Global Fund Manager Survey today. Last month there were concerns about Goldilocks Running Out Of Cash, today the key conclusions are as follows:

Goldilocks emigrates to US but fears it’s all been a dream
The May FMS saw the impact of a straightforward growth shock. Eurozone fiscal
concerns plus worries on China tightening has led to a rapid cooling in global growth expectations to +72 from +82 (back to levels of May 2009). This was headlined by a 17-point fall in EU growth outlook to +67; the second biggest 1-
month fall on record. A net 3% of regional PMs now expects a weaker Chinese
economy over the next 12 months (the first negative reading since March 2009).

Liquidity silver lining?
Interest rate expectations continue to be pushed back with almost 60% of investors seeing no Fed move before 2011 at the earliest. Even more conclusive is that 89% of investors see no ECB move before next year.

Cash levels restored; US is region of choice
Average cash levels moved sharply higher to 4.3% (from 3.5%) ending the sell signal triggered last month but falling short of a buy signal at 4.5%. After the extreme optimism of April, asset allocators cut equity overweight to a net 30%from 52%); bonds benefited, climbing 19 points to a net 29% UW. US is now the region of choice (+22% OW) as GEM conviction has waned (19% OW vs 31% in April). Despite risk aversion commodities retained support at 17% OW (from 20%)helped by a net 13% viewing oil as undervalued (from 2% overvalued in April).

Relative pessimism on Europe starts to look stretched
The differential in 12-month relative corporate profit outlook between EU and US is now at the highest level since July 2003. As much as the US (and US$) is, understandably, viewed as a safe haven, the relative optimism looks close to contrarian trigger levels. While falling back from the multi-year high seen last month, investors remain OW Japan in regional allocations (net 5% vs. 12%).

Growth concerns but pro-cyclical sector tilt retained
Concerns over global growth saw broad rotation into defensive sectors out of banks and basic materials. However, the top-3 sectors remain technology, energy and industrial suggesting the cyclical trade retains some attractions. Three big GEM-demand related sectors (industrials, staples and materials) are now seen as overvalued but remain overweight in portfolios.

Contrarian pain
US underperforms vs. Europe. $ falls vs. Yen and Euro. Buy utilities & banks; sell technology & industrials. Back testing indicators say buy EU, sell US in terms of relative regional preferences.


Click on chart to enlarge, courtesy of BofA Merrill Lynch.
Mid-cycle crisis ongoing? Is Goldilocks (that has moved to US now) a normal precursor of a Minsky moment?

Global Equity Price/Book & Debt/GDP By Country

Nice chart from the house of Nomura, click on chart to enlarge.


Monday, May 17, 2010

More Charts Of US Growth Story

I started to wonder some time ago, but the following charts should lend more insights into sustainability of "We are U.S.A!".

Christopher Wood, the strategist at CLSA Asia-Pacific Markets, wrote last week:
As for US personal consumption in aggregate, it has risen by US$518bn since December 2008 to an annualised US$10.4tn in March. While personal current transfer receipts have risen by US$321bn over the same period with personal taxes decreasing by US$271bn.

Click on chart to enlarge, courtesy of CLSA Asia-Pacific Markets.

Further on, the economists at UniCredit have excluded inventories and impact of fiscal stimulus from GDP, and compared to actual GDP figures. Readers are asked to exclude also the forecasts (light gray bars and dotted line). Click on chart to enlarge, courtesy of UniCredit.

Interestingly, how much would we see of GDP growth, if we may exclude also Ponzi-reflation profits at banks?

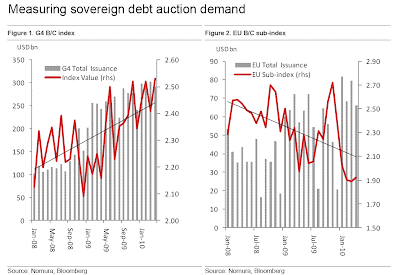
Nomura's Bid-To-Cover Indices

Nomura has created:
... an index of sovereign debt auction demand for the G4 bond markets based on the auctions’ bid/cover ratios.
Index is calculated by adjusting each region’s average bid/cover ratio to a normalised generic mean, accounting also for the size of its bond market. In this way Nomura is trying to neutralise idiosyncratic elements of each market that may skew the bid/cover ratios either upwards or downwards.

Click on charts to enlarge, courtesy of Nomura.


EU sub-index shows deterioration. But what about the mythical "direct bidders" in the US?

Friday, May 14, 2010

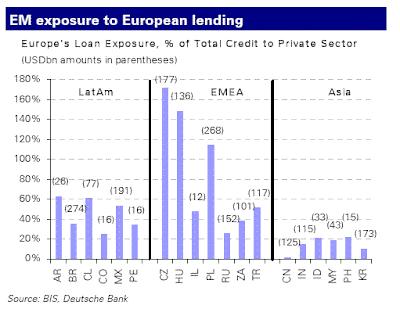
Fiscal & Debt Positions In Emerging Markets Compared, Exposure To European Lending

This should complement the previous post also ...

Safe Haven in Emerging Markets? Standard Chartered notes today:
If the crisis escalates, Asia could be affected via several channels: reduced bank lending from Europe (as of end-2009, continental European banks accounted for 25%, or USD 434bn, of total BIS bank lending to emerging Asia), a collapse in trade flows (Europe represents a marginally larger slice of Asia’s trade than the US, with China, Hong Kong, Korea, Malaysia and Singapore the most vulnerable), and through potential asset price inflation in Asia, with Europe’s low-interest-rate environment feeding capital flows into Asia.
Some countries in emerging countries have also large fiscal deficits and reliance on government debt. Click on chart to enlarge, courtesy of Standard Chartered.

Economists at Deutsche Bank were pointing to EMEA and LatAm yesterday, as the most vulnerable regions depending on European lending:

According to BIS data as of December 2009, the total loan exposure of EMEA countries to European banks was the largest at USD963bn, followed by LatAm with USD600bn and Asia with USD505bn. The differences, however, are more striking when the exposure is measured as a percentage of GDP. In EMEA, the figure is equivalent to 47%, in LatAm is 19% and in Asia is only 7%. Finally, loan exposure to Europe as a percentage of bank credit to the private sector is also the highest in EMEA at 58%, followed by LatAm at 42% and Asia at 5%. It is worth noting that the BIS figures reflect consolidated foreign claims vis-à-vis individual countries by nationality of reporting banks, thus possibly differing from some of the data provided by each individual central bank when reporting domestic and foreign debt.

Click on chart to enlarge, courtesy of Deutsche Bank.

Then, also regulators will eat something in Europe too...

Thursday, May 13, 2010

Wednesday, May 12, 2010

Dysfunctional Debt Securities Markets

Who cares, why debt securities markets get dysfunctional? More important, whatever cost, to:
... address the malfunctioning of securities markets and restore an appropriate monetary policy transmission mechanism.
Since the end of 2007 banks have it difficult to fund themselves in debt markets (and not only in the Euro area) versus non-financials. It is better to cheat the money markets via ZIRP. By the way, ZIRP sets the extreme limit for credit markets to "eat" the "non-existing" relative value via ever lower policy rates.

Click on chart to enlarge, courtesy of Nomura.


Tuesday, May 11, 2010

Three Chinese Bears

Well, I have not covered China for some time now, but the weakness of Asian equities this morning after the loud Western celebrations yesterday, makes me thinking that they are worth making a stop here too.

Let' s look at Shanghai Composite, that broke the triangle to the downside, and sits on the September 2009 lows right now. Index is very oversold technically, and should consolidate at least, but, if we break down, then the party may be really over ...

Click for up-to-date chart via StockCharts.com here, and click on chart below to enlarge.

The economists at Societe Generale wrote this morning:
... don't forget that Goldilocks, somewhat ironically, stumbled into an empty house before pillaging finite resources (food) off 3 bears. China does indeed have 3 bears. The big bear continues to be property, the second bear inflation, and the third bear, generalised overheating.
Rather, I got a distinct message from the source on the ground today:
... liquidity would be tightened in Q2. Incremental M2 growth is already turning negative on a %y/y basis, and we could be seeing up to -30% incremental growth over the next 3-6 months if they don’t relax credit controls. (Total outstanding M2 growth will remain positive, but the incremental change will go negative for a number of months on a %y/y basis).
It should not be anything new to the readers, but the good folks at BCA Research were highlighting today, though:
Business-cycle indicators out of Asia are warning of caution as the period of growth moderation is in the cards.
They are also concerned about emerging markets equities. Click on charts to enlarge, courtesy of BCA Research.

So, watch out!

Price For Fiscal Dis-Union

Look at the fiscal underdogs of UK and US, and compare the numbers to the Eurozone ... while Eurozone pays the price now, I fear the markets will give the chance to UK and US too.

Click on table to enlarge, courtesy of Deutsche Bank.


Monday, May 10, 2010

Equities Are Not An Asset

While the markets are celebrating the Euro-zone bail-out, let's dive into the words of legendary Russell Napier that gave an interview in latest MoneyWeek magazine:
... Equities are not an asset. They are a fine sliver of hope between assets and liabilities. ..
On general economics, there is an interesting read by Adair Turner: "Economics, conventional wisdom and public policy".

And look at this, if you want to know what happens in markets, when bank robots go on strike ...

Sunday, May 09, 2010

Knock-Down Of The Last Week

The Mother Nature was so great to knock me down with a fever, so I had hard time to make a post, however I had the chance to experience all the brutish realities of markets, but you were cautioned in advance ...

The Crash of 14:45 on Thursday is worth listing the Dow credentials here (H/T FT Alphaville):
DJIA, down 347.80 points, or 3.20% to 10520.32
Biggest point drop since February 10, 2009.
Biggest percentage drop since April 20, 2009.
Down three straight days and four of the last five.
Down 631.51 points, or 5.66% the past three sessions.
Biggest three-day point drop since the three-day ended November 20, 2008.
Biggest three-day percent drop since the three-day ended March 3, 2009.
The last time the DJIA had a three day drop was the three-days ended January 22.
Lowest close since March 4.
Hit an intraday high of 10879.76 today, up 11.64 points, or 0.11%
Hit an intraday low of 9869.62 today, down 998.50 points, or 9.19%
Biggest intraday drop in its history.
Had an intraday high-low swing of 1010.14 points
Paul Kedrosky at Infectious Greed listed two nice videos of Live Crash Media from Crash of 05/06/10 14:45, get hands on. Trader's Narrative is trying to bring a more rational technical insight into crash, but please also pay attention to Primary Trend!

All in all, nothing has changed in the mood of US business media, as economic indicators are surprising on the upside. All what happens in markets is caused by and should be a problem of others. At least so far Americans try to position themselves like they are decoupling from the rest of the world. Some people see it quite an interesting development, but some are trying to say that sustainable US consumer is back!

Well, US consumer is no better than Greek or Spaniard, runs current account and huge budget deficit. If it was sub-prime finance that was justifying unsustainable consumption in 2007 or 2008, now it is Uncle Sam itself ...

Sean Corrigan of Diapason Commodities was excellent to single it out in the following picture. Click to enlarge, courtesy of Diapason Commodities.


So, enjoy the arrogance and denial ... till recognition comes, and faster than I expected?