I am back, but I cannot promise the posting will be regular going forward.
My "focus list" consisting of Spanish and Italian bonds, and JPY worked well, however all of those instruments have experienced interventions by central banks and cannot be considered as leading indicators anymore.
The liquidity crisis usually resolves with a victim, and while none of fundamental macro problems have been solved, the liquidity will just postpone the resolution.
However, for the greedy people we all are, I would be still cautious beyond the obvious speculative action. Danske Bank had a good reminder yesterday, see the picture below, but you decide whether the witch-hunt has ended.
Click on picture to enlarge, courtesy of Danske Bank Markets.
Showing posts with label Banks. Show all posts
Wednesday, August 24, 2011
Monday, July 04, 2011
Credit Agricole: Sisyphus Cannot Simply Kick The Can Down The Road
Posting will be very light, or even absent in July. For the longer reading the latest macro prospects by Credit Agricole are at your disposal here.
Tuesday, June 28, 2011
China's Local Government Financing
On a day when markets seek for a Greek relief rally, as the Greek default may appear like mission impossible and the real challenge for Greeks now to get into such mess, I am looking at "perceived hope" of growth in China, while the financing of that growth becomes more riskier. The economists at Societe Generale are offering their views on China's local government financing issues today. I skip here the consensus optimism, but look at potential problems, as per economists at Societe Generale:
...China’s local government debt problem is scary in different ways. A simple calculation based on the information available in the report suggests that the total debt load increased 36 times in nominal terms and fivefold relative to GDP between 1997 and 2010! More than 80% of the money has gone to finance hard infrastructure. Economically speaking, an increasingly bigger share of total capital has been allocated to the public sector, and the marginal return of each borrowed yuan has been on a steady decline. In the last three years, total liabilities of local governments nearly doubled in size and ballooned from 17% to 27% of GDP. The health of China’s public debt and investments is deteriorating at its fastest pace ever.
Click on charts to enlarge, courtesy of Societe Generale.
Now, if one assumes that investments are "hard infrastructure" and often (about one quarter) of "debt is promised with land sales revenues", the maturity profile may provide some challenges as loans are maturing.
But then again, quoting the economists at Societe Generale:
... we can say China is different as there is no clear trigger of a sudden emergence of bad debt. Both debtors and creditors belong to the government, more or less.
...China’s local government debt problem is scary in different ways. A simple calculation based on the information available in the report suggests that the total debt load increased 36 times in nominal terms and fivefold relative to GDP between 1997 and 2010! More than 80% of the money has gone to finance hard infrastructure. Economically speaking, an increasingly bigger share of total capital has been allocated to the public sector, and the marginal return of each borrowed yuan has been on a steady decline. In the last three years, total liabilities of local governments nearly doubled in size and ballooned from 17% to 27% of GDP. The health of China’s public debt and investments is deteriorating at its fastest pace ever.
Click on charts to enlarge, courtesy of Societe Generale.
Now, if one assumes that investments are "hard infrastructure" and often (about one quarter) of "debt is promised with land sales revenues", the maturity profile may provide some challenges as loans are maturing.
But then again, quoting the economists at Societe Generale:
... we can say China is different as there is no clear trigger of a sudden emergence of bad debt. Both debtors and creditors belong to the government, more or less.
Thursday, June 23, 2011
80 JPY In Focus Too
Another "inflection point" on my screens is the mark of 80 Japanese yens (JPY) per 1 US dollar. This is rather important for Japan in watching the Chinese slowdown.
"... Preliminary China June PMI Falls to 11-Month Low", as per WSJ.com today:
The preliminary HSBC PMI declined from a final reading of 51.6 in May, while the manufacturing output sub-index fell to an 11-month low of 50 from the previous month's 50.9, HSBC Holdings PLC said Thursday.
Of course, the soft landing in China is consensus view, but the tight liquidity situation may bring some "fat tails". However, the 80 JPY mark will show where the market goes ...
Click on chart to enlarge, courtesy of Reuters.
"... Preliminary China June PMI Falls to 11-Month Low", as per WSJ.com today:
The preliminary HSBC PMI declined from a final reading of 51.6 in May, while the manufacturing output sub-index fell to an 11-month low of 50 from the previous month's 50.9, HSBC Holdings PLC said Thursday.
Of course, the soft landing in China is consensus view, but the tight liquidity situation may bring some "fat tails". However, the 80 JPY mark will show where the market goes ...
Click on chart to enlarge, courtesy of Reuters.
Thursday, June 16, 2011
Jump In Correlations In European Credit Markets
The message from credit strategists at BNP Paribas today:
A confluence of events has increased volatility which could turn systemic in nature. With correlations bunching up once again and trending towards 1.0, the message from the markets is loud and clear that systemic risk is rising and liquidity is poor, which is being reflected in higher volatility and risk premia.
Click on chart to enlarge, courtesy of BNP Paribas.
If this is not enough, one should consider - what has made US markets "so weak" recently?
Click on chart to enlarge, courtesy of BNP Paribas.
Well, ECRI tells us not to blame Japan for slowdown ...
A confluence of events has increased volatility which could turn systemic in nature. With correlations bunching up once again and trending towards 1.0, the message from the markets is loud and clear that systemic risk is rising and liquidity is poor, which is being reflected in higher volatility and risk premia.
Click on chart to enlarge, courtesy of BNP Paribas.
If this is not enough, one should consider - what has made US markets "so weak" recently?
Click on chart to enlarge, courtesy of BNP Paribas.
Well, ECRI tells us not to blame Japan for slowdown ...
Tuesday, June 14, 2011
No Capitulation For Merrill's Fund Managers
They were about Fading Or Risking last month, this month key messages from BofA Merrill Lynch Global Fund Manager Survey are as follows:
No capitulation... no QE3
In the June FMS investors raised cash, reduced risk asset exposure and rotated to defensive sectors. But investor panic is not yet visible. The recent drop in global growth expectations stabilized and despite sharply lower inflation readings, two-thirds of investors predict no QE3.
Growth expectation stabilise
Growth and profit expectations stabilised after recent sharp falls. Inflation expectations fell to 38% from 69% two months ago. But the macro backdrop is not seen as weak enough to warrant more stimulus: three out of four panellists think a recession unlikely and only 13% expect a new round of QE in H2.
Risk is off
The percentage of investors OW cash rose to 21%, the highest since July-09. Actual cash balances rose from 3.9% to 4.2% but this did not trigger a buy signal from our trading rule. Hedge funds cut gearing levels sharply to 1.27x from 1.53x while 43% of investors believe EU sovereign debt funding is the biggest "tail risk". Overall our risk & liquidity index fell to 38, below its long term average of 40.
Gold overvaluation highest since 2009
Equity allocations fell, benefiting bonds and cash, but positioning overall stands in the middle of historic ranges. Note that the gold price is seen as more overvalued than at anytime since Dec-09 while commodity allocations again fell.
Japan remains most unloved market
Despite China growth expectations dropping to the lowest reading since Jan-09, EM remains the most preferred region for equities, pipping the US. Regional allocations show a big drop in exposure to Eurozone and UK equities but Japan remains the most unloved equity region.
Bank underweight most negative since March 2009
Contrarians note that the weighting in global banks fell to its lowest since March 2009. Consumer discretionary saw the largest monthly drop in exposure with the only positive sector moves coming from defensives. Tech remains the most popular sector followed by pharma and energy.
Contrarian trades...
Despite no contrarian "buy" signal for risk being triggered, the contrarian trades within the June FMS are: long banks, short gold; long Japanese banks, short US tech; long Eurozone, short EM; long US dollar, short Japanese yen.
Click on chart to enlarge, courtesy of BofA Merrill Lynch.
I have no intention to be contrarian this month ...
No capitulation... no QE3
In the June FMS investors raised cash, reduced risk asset exposure and rotated to defensive sectors. But investor panic is not yet visible. The recent drop in global growth expectations stabilized and despite sharply lower inflation readings, two-thirds of investors predict no QE3.
Growth expectation stabilise
Growth and profit expectations stabilised after recent sharp falls. Inflation expectations fell to 38% from 69% two months ago. But the macro backdrop is not seen as weak enough to warrant more stimulus: three out of four panellists think a recession unlikely and only 13% expect a new round of QE in H2.
Risk is off
The percentage of investors OW cash rose to 21%, the highest since July-09. Actual cash balances rose from 3.9% to 4.2% but this did not trigger a buy signal from our trading rule. Hedge funds cut gearing levels sharply to 1.27x from 1.53x while 43% of investors believe EU sovereign debt funding is the biggest "tail risk". Overall our risk & liquidity index fell to 38, below its long term average of 40.
Gold overvaluation highest since 2009
Equity allocations fell, benefiting bonds and cash, but positioning overall stands in the middle of historic ranges. Note that the gold price is seen as more overvalued than at anytime since Dec-09 while commodity allocations again fell.
Japan remains most unloved market
Despite China growth expectations dropping to the lowest reading since Jan-09, EM remains the most preferred region for equities, pipping the US. Regional allocations show a big drop in exposure to Eurozone and UK equities but Japan remains the most unloved equity region.
Bank underweight most negative since March 2009
Contrarians note that the weighting in global banks fell to its lowest since March 2009. Consumer discretionary saw the largest monthly drop in exposure with the only positive sector moves coming from defensives. Tech remains the most popular sector followed by pharma and energy.
Contrarian trades...
Despite no contrarian "buy" signal for risk being triggered, the contrarian trades within the June FMS are: long banks, short gold; long Japanese banks, short US tech; long Eurozone, short EM; long US dollar, short Japanese yen.
Click on chart to enlarge, courtesy of BofA Merrill Lynch.
I have no intention to be contrarian this month ...
Monday, June 13, 2011
Barclays On US Deflation Risks
While the equity investors like the industrialists of Weimar Republic are awaiting for the first hints of QE3 by Fed, I was a bit surprised that the risk of deflation appears like a distant probability. Here the latest take by economists at Barclays Capital:
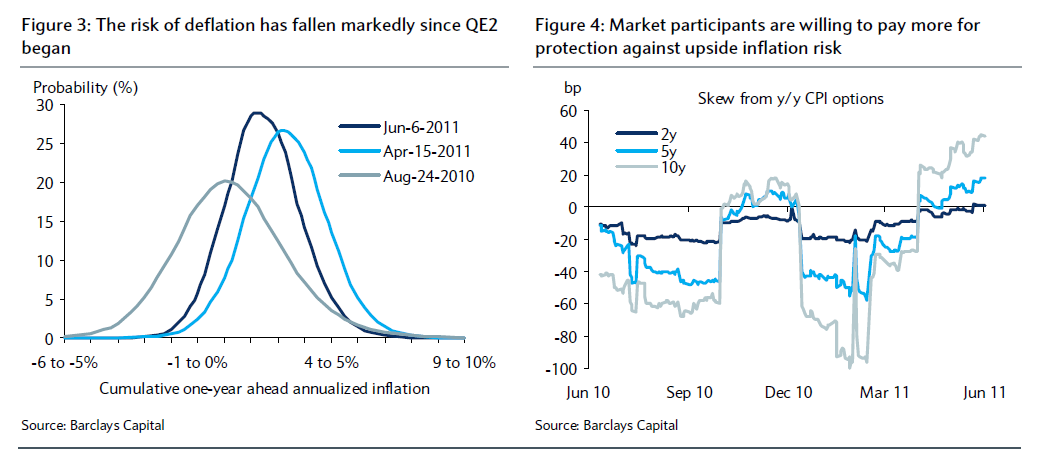
The increase in inflation and inflation expectations has also coincided with a reduction in deflation risk. Figure 3 shows the probability of cumulative inflation over a one-year horizon using information from both TIPS and CPI options data. The figure shows that the probability of deflation over the one-year ahead horizon in August of last year was 36%. When 5y5y breakeven inflation reached its recent high in April of this year, the probability had fallen to about 3%. Currently, it stands at about 7%. In addition, Figure 4 shows that the market remains more willing to pay for protection against upside inflation risks than protection against excessive deflation risk. The figure plots the difference in premiums paid on +200bp out-of-the-money inflation caps and -200bp out-of-the-money inflation floors for different horizons. Because an inflation cap pays off when cumulative inflation exceeds the threshold specified in the contract, a positive reading is an indication that the caps are more expensive than the floors; in other words, the market sees the distribution of expected inflation as skewed in the direction of upside inflation risk. The trends from CPI options markets suggest that skew has been moving in the direction of willingness to pay for protection against upside inflation risk, whereas for much of last year, participants were willing to pay more for protection against deflation.
Altogether, we see the trends in inflation markets as consistent with Chairman Bernanke’s comments in his April press conference that the balance of risks between seeking additional progress on its dual mandate relative to further balance sheet expansion was “less attractive” than it was a year earlier. We therefore see the Fed as inclined to remain patient. If incoming data confirm the Fed’s view that the economy is turning up in the second half of the year, the FOMC will likely continue on its path towards normalizing the policy stance. However, if the recovery fails to regain momentum, the balance of risks may shift back in favor of further Fed action.
Click on charts to enlarge, courtesy of Barclays Capital.
Well, just in case ... "if the recovery fails to regain momentum". Why it should?
The increase in inflation and inflation expectations has also coincided with a reduction in deflation risk. Figure 3 shows the probability of cumulative inflation over a one-year horizon using information from both TIPS and CPI options data. The figure shows that the probability of deflation over the one-year ahead horizon in August of last year was 36%. When 5y5y breakeven inflation reached its recent high in April of this year, the probability had fallen to about 3%. Currently, it stands at about 7%. In addition, Figure 4 shows that the market remains more willing to pay for protection against upside inflation risks than protection against excessive deflation risk. The figure plots the difference in premiums paid on +200bp out-of-the-money inflation caps and -200bp out-of-the-money inflation floors for different horizons. Because an inflation cap pays off when cumulative inflation exceeds the threshold specified in the contract, a positive reading is an indication that the caps are more expensive than the floors; in other words, the market sees the distribution of expected inflation as skewed in the direction of upside inflation risk. The trends from CPI options markets suggest that skew has been moving in the direction of willingness to pay for protection against upside inflation risk, whereas for much of last year, participants were willing to pay more for protection against deflation.
Altogether, we see the trends in inflation markets as consistent with Chairman Bernanke’s comments in his April press conference that the balance of risks between seeking additional progress on its dual mandate relative to further balance sheet expansion was “less attractive” than it was a year earlier. We therefore see the Fed as inclined to remain patient. If incoming data confirm the Fed’s view that the economy is turning up in the second half of the year, the FOMC will likely continue on its path towards normalizing the policy stance. However, if the recovery fails to regain momentum, the balance of risks may shift back in favor of further Fed action.
Click on charts to enlarge, courtesy of Barclays Capital.
Well, just in case ... "if the recovery fails to regain momentum". Why it should?
Thursday, May 26, 2011
BNP Paribas: US Bank Credit Has Underperformed Europe's
Indeed, interesting, brought to you by credit strategists at BNP Paribas today, my emphasis in bold and underlined:
It is interesting to note that while European bank paper (Senior and LT2) has widened on the back of sovereign concerns, US bank paper (Senior and LT2) has widened more over the last month due to housing double-dip, legal issues and relatively weaker economic environment. This US bank underperformance stresses two key points, namely that the GIP sovereign crisis is increasingly being seen as idiosyncratic and manageable while the US economic slowdown if sustained is likely to become a bigger issue in June.
Click on charts to enlarge, courtesy of BNP Paribas.
Well, let's see!
It is interesting to note that while European bank paper (Senior and LT2) has widened on the back of sovereign concerns, US bank paper (Senior and LT2) has widened more over the last month due to housing double-dip, legal issues and relatively weaker economic environment. This US bank underperformance stresses two key points, namely that the GIP sovereign crisis is increasingly being seen as idiosyncratic and manageable while the US economic slowdown if sustained is likely to become a bigger issue in June.
Click on charts to enlarge, courtesy of BNP Paribas.
Well, let's see!
Wednesday, May 25, 2011
Profit Margins Again
It just happens, as a follow-up on the post from yesterday, also the economists at BCA Research made their conclusions on the corporate profit margins yesterday. So, here some excerpts to consider:
Ultimately, the health of the corporate sector depends on the financial health of its customers. Thus, the divergence between rising profits and weak growth in real consumer incomes will have to change. Historically, the growth in real profits has been correlated closely with that of real consumer spending, and the wide gap in the current cycle represents a major aberration.
I have discussed the real consumer spending and especially the incomes that should drive that spending here earlier. So, here are the mains points about margins, according to BCA Research:
To conclude, the corporate sector has been enjoying a very favorable set of circumstances that will not persist. This does not mean that profit margins are about to plunge. Companies will remain intensely focused on cost control and boosting efficiency, and the weak dollar will continue to provide support to overseas earnings. However, it is hard to see margins moving higher from current levels in the coming year.
Margins and thus profits will face a severe challenge during the next recession. The ability to repeat this cycle’s aggressive cost cutting will be minimal, and pricing power will be under pressure. If we are going to have a mean reversion of margins, then that is when it will occur. A severe margin squeeze does not seem likely while the economy is still expanding.
All in all, not bad? Just imagine how much money has been thrown at non-existing problems. Save that challenge for next recession, while at least couple of bears were growling also today ...
Ultimately, the health of the corporate sector depends on the financial health of its customers. Thus, the divergence between rising profits and weak growth in real consumer incomes will have to change. Historically, the growth in real profits has been correlated closely with that of real consumer spending, and the wide gap in the current cycle represents a major aberration.
I have discussed the real consumer spending and especially the incomes that should drive that spending here earlier. So, here are the mains points about margins, according to BCA Research:
To conclude, the corporate sector has been enjoying a very favorable set of circumstances that will not persist. This does not mean that profit margins are about to plunge. Companies will remain intensely focused on cost control and boosting efficiency, and the weak dollar will continue to provide support to overseas earnings. However, it is hard to see margins moving higher from current levels in the coming year.
Margins and thus profits will face a severe challenge during the next recession. The ability to repeat this cycle’s aggressive cost cutting will be minimal, and pricing power will be under pressure. If we are going to have a mean reversion of margins, then that is when it will occur. A severe margin squeeze does not seem likely while the economy is still expanding.
All in all, not bad? Just imagine how much money has been thrown at non-existing problems. Save that challenge for next recession, while at least couple of bears were growling also today ...
Thursday, May 19, 2011
Still Some Adjustments In Labor Legacy Costs To Expect
Charts below are self-explanatory, while housing is non-productive and legacy cost of domestic labor. I marked some countries that I believe deserve attention.
Click on charts to enlarge, courtesy of Goldman Sachs, my annotations in red and yellow.
More than couple of those "marked" countries are enjoying record high housing prices in nominal, real and relative terms now.
Click on charts to enlarge, courtesy of Goldman Sachs, my annotations in red and yellow.
More than couple of those "marked" countries are enjoying record high housing prices in nominal, real and relative terms now.
Tuesday, May 17, 2011
European Debt Sinners
While Europeans are not the only sinners, the majority of brains with money are focused on EU sovereign debt issues. Economists at Erste Bank delivered excellent reminders today - who is who in this game?
Click on charts to enlarge, courtesy of Erste Bank.
Merrill's Fund Managers Are Fading Or Risking
We saw Reluctant Equity Bulls last month, this month key messages from BofA Merrill Lynch Global Fund Manager Survey are as follows:
The potential summer surprises
The May FMS sees investors questioning global growth (in a re-run of summer 2010) but enjoying ample liquidity that keeps risk appetite high. A stand-off has ensued with little change in allocation across asset classes but some switching within asset classes, typified by defensive rotation within equities. The summer surprises are either growth to the upside or liquidity disappointing as QE2 ends.
Growth expectations are falling
Only a net 10% of investors expect stronger global economic growth in the next 12m, down from 58% in Feb. This is easing inflation concerns, albeit marginally, with a net 61% seeing higher inflation down from 75% in March.
Risk appetite resilient
Three-quarters of the panel expect no Fed rate rise before 2012 and so risk appetite remains firm. Hedge funds are risk-on with 1.53x gearing the highest since Nov-07. Cash balances rose to 3.9% up from 3.7%, but remain low. Our risk appetite indicator eased to 43 but is well above the average of 40.
EU debt the tail risk but watch China
Growth fears see EU debt issues again ranking as the main investment risk. A slightly lower EU growth outlook (49 vs. 52) is being offset by US resilience and a rebound in Japan sentiment (74 vs. 42). A bigger concern is the deeper decline in China optimism with a net 28% seeing weaker growth compared to 15% in March.
Asset allocation: very modest change
Asset allocation saw modest rotation into bonds (48% UW from 58%) funded by lower commodities (12% OW vs. 24%) and equities (41% OW vs. 50%). GEM regains its position of most preferred region (29% OW vs. 22%) replacing US (26% OW). Consensus is UW Europe (-1%) and Japan (-17%). USD sentiment (48% undervalued) is one of the highest readings since 2002.
Sector rotation: defensive rotation
Sharp falls in energy (to 19% OW from 40%) and materials (2% UW from 17% OW) accompanied a sharp defensive rotation into staples (8% OW from 6% UW), pharma and telecoms. Banks are once again the most unpopular sector (26% UW down from 15%) with technology by far the most popular (35% OW).
How to trade the risk scenarios
If the summer sees stronger-than-expected growth: long banks, short pharma; long commodities, short bonds. If the summer sees weaker liquidity: long bonds, short equities; long US$, short EM.
Click on chart to enlarge, courtesy of BofA Merrill Lynch.
While there is still room for "feel good" short-term rally, it is more likely to see weaker liquidity over summer ...
The potential summer surprises
The May FMS sees investors questioning global growth (in a re-run of summer 2010) but enjoying ample liquidity that keeps risk appetite high. A stand-off has ensued with little change in allocation across asset classes but some switching within asset classes, typified by defensive rotation within equities. The summer surprises are either growth to the upside or liquidity disappointing as QE2 ends.
Growth expectations are falling
Only a net 10% of investors expect stronger global economic growth in the next 12m, down from 58% in Feb. This is easing inflation concerns, albeit marginally, with a net 61% seeing higher inflation down from 75% in March.
Risk appetite resilient
Three-quarters of the panel expect no Fed rate rise before 2012 and so risk appetite remains firm. Hedge funds are risk-on with 1.53x gearing the highest since Nov-07. Cash balances rose to 3.9% up from 3.7%, but remain low. Our risk appetite indicator eased to 43 but is well above the average of 40.
EU debt the tail risk but watch China
Growth fears see EU debt issues again ranking as the main investment risk. A slightly lower EU growth outlook (49 vs. 52) is being offset by US resilience and a rebound in Japan sentiment (74 vs. 42). A bigger concern is the deeper decline in China optimism with a net 28% seeing weaker growth compared to 15% in March.
Asset allocation: very modest change
Asset allocation saw modest rotation into bonds (48% UW from 58%) funded by lower commodities (12% OW vs. 24%) and equities (41% OW vs. 50%). GEM regains its position of most preferred region (29% OW vs. 22%) replacing US (26% OW). Consensus is UW Europe (-1%) and Japan (-17%). USD sentiment (48% undervalued) is one of the highest readings since 2002.
Sector rotation: defensive rotation
Sharp falls in energy (to 19% OW from 40%) and materials (2% UW from 17% OW) accompanied a sharp defensive rotation into staples (8% OW from 6% UW), pharma and telecoms. Banks are once again the most unpopular sector (26% UW down from 15%) with technology by far the most popular (35% OW).
How to trade the risk scenarios
If the summer sees stronger-than-expected growth: long banks, short pharma; long commodities, short bonds. If the summer sees weaker liquidity: long bonds, short equities; long US$, short EM.
Click on chart to enlarge, courtesy of BofA Merrill Lynch.
While there is still room for "feel good" short-term rally, it is more likely to see weaker liquidity over summer ...
Wednesday, May 11, 2011
Spanish Insolvencies
You thought that situation in Spain is stabilising? Well, the analysts at German Commerzbank write today:
According to provisional data of the national statistical office, the number of insolvencies in Spain reached a new high in the first quarter. The recovery of autumn 2010 was therefore short-lived. The property sector’s share of bankruptcies remains strikingly high: Property developers or construction companies accounted for nearly a third of all business failures. This persistent concentration shows that the consolidation of the Spanish real estate market is still not over. At the same time, house prices continued their downward trend: At the end of March the house price index had fallen by a further 4.6% yoy. Pressure on asset quality in the credit portfolios of Spanish financial institutions therefore appears likely to continue for the time being.
Click on charts to enlarge, courtesy of Commerzbank.
Right, all is contained and under control, as always ....
According to provisional data of the national statistical office, the number of insolvencies in Spain reached a new high in the first quarter. The recovery of autumn 2010 was therefore short-lived. The property sector’s share of bankruptcies remains strikingly high: Property developers or construction companies accounted for nearly a third of all business failures. This persistent concentration shows that the consolidation of the Spanish real estate market is still not over. At the same time, house prices continued their downward trend: At the end of March the house price index had fallen by a further 4.6% yoy. Pressure on asset quality in the credit portfolios of Spanish financial institutions therefore appears likely to continue for the time being.
Click on charts to enlarge, courtesy of Commerzbank.
Right, all is contained and under control, as always ....
Tuesday, May 10, 2011
Alternate Seasonality At Citi
This should be an interesting approach. The small and mid cap strategists at Citi went so far to write yesterday:
This “Topics” note provides a historical look at summer seasonal trading patterns, but with an alternate set of data where we remove recessionary periods, including the “tech bubble” time period, as well as the outlier circumstance that contained the ’87 “crash”. We acknowledge that this approach entails a large element of subjectivity but, nevertheless, provides an interesting, and alternative, set of observations. Figure 1 shows the seasonal trading pattern for the Russell 2000 with all periods since index inception in 1979 included. Figure 2 provides the “alternate” look.
Click on charts to enlarge, courtesy of Citigroup Global Markets.
And it continues just like this:
The takeaway of this analysis is two fold. First, there is clear evidence of small cap seasonality during the summer months, when viewed back to Russell 2000 inception circa 1979. Second, when the ’81-’82, ’90-91 and ’08-’09 recessionary periods, along with the ’98-’02 “tech bubble” phase are removed from the seasonal analysis, a much more benign summer seasonal trading picture emerges.
We acknowledge the inherent difficulties in defining “mid cycle” from a traditional statistical perspective. While removing “recessionary” periods, as well as the tech bubble phase, increases risk of data manipulation, we argue that this is, nevertheless, as relevant as traditional historical analysis, where average calculations can be overly influenced by outlier periods.
So, we acknowledge, but we will do much more to talk up? Hey, but this is normal market practice, just assume, e.g., money market indices in Europe ...
This “Topics” note provides a historical look at summer seasonal trading patterns, but with an alternate set of data where we remove recessionary periods, including the “tech bubble” time period, as well as the outlier circumstance that contained the ’87 “crash”. We acknowledge that this approach entails a large element of subjectivity but, nevertheless, provides an interesting, and alternative, set of observations. Figure 1 shows the seasonal trading pattern for the Russell 2000 with all periods since index inception in 1979 included. Figure 2 provides the “alternate” look.
Click on charts to enlarge, courtesy of Citigroup Global Markets.
And it continues just like this:
The takeaway of this analysis is two fold. First, there is clear evidence of small cap seasonality during the summer months, when viewed back to Russell 2000 inception circa 1979. Second, when the ’81-’82, ’90-91 and ’08-’09 recessionary periods, along with the ’98-’02 “tech bubble” phase are removed from the seasonal analysis, a much more benign summer seasonal trading picture emerges.
We acknowledge the inherent difficulties in defining “mid cycle” from a traditional statistical perspective. While removing “recessionary” periods, as well as the tech bubble phase, increases risk of data manipulation, we argue that this is, nevertheless, as relevant as traditional historical analysis, where average calculations can be overly influenced by outlier periods.
So, we acknowledge, but we will do much more to talk up? Hey, but this is normal market practice, just assume, e.g., money market indices in Europe ...
Monday, May 09, 2011
Real Interest Rates And Credit Growth In Asia
The last days are traded in the sign of Greek-out, but for the sake of change we travel to Asia today.
This is a nice depiction of real growth drivers in Asia too. You simply arrange the God's Work with negative real rates, and credits simply fly, as economists at Deutsche Bank are writing:
Declining, and often negative, real interest rates against a backdrop of strong growth provide strong support for credit growth, which is rising in most Asian economies.
Click on chart to enlarge, courtesy of Deutsche Bank.
While I am not so sure that "strong growth provide strong support for credit growth", I would rather think the other way round. However, this seems to be more important now:
China is a key exception. Despite negative real interest rates, credit growth has slowed for most of the last 18 months after the surge in lending in support of the government’s stimulus program in early 2009. Interest rates do not play an important role in allocating or managing credit growth in China.
And once again, if you doubt the first paragraph, can you trust the second quote?
This is a nice depiction of real growth drivers in Asia too. You simply arrange the God's Work with negative real rates, and credits simply fly, as economists at Deutsche Bank are writing:
Declining, and often negative, real interest rates against a backdrop of strong growth provide strong support for credit growth, which is rising in most Asian economies.
Click on chart to enlarge, courtesy of Deutsche Bank.
While I am not so sure that "strong growth provide strong support for credit growth", I would rather think the other way round. However, this seems to be more important now:
China is a key exception. Despite negative real interest rates, credit growth has slowed for most of the last 18 months after the surge in lending in support of the government’s stimulus program in early 2009. Interest rates do not play an important role in allocating or managing credit growth in China.
And once again, if you doubt the first paragraph, can you trust the second quote?
Friday, May 06, 2011
Listening To Valuable Voice Of Jean-Marie Eveillard
Look for the MP3 link via King World News.
Wednesday, May 04, 2011
Victory Of Monetarism At Citi
Tobias Levkovich, the US equity strategist at Citigroup, posted the "chart of the month" yesterday, and the monetarism obviously leads the investment idea there:
Credit conditions remain critical for business investment and economic activity. The latest senior loan officers survey released by the Federal Reserve Board shows further easing in loan standards during 2Q11 (including those for small business and consumers) which has been a powerful nine-month lead indicator for investments in human, physical and working capital. As credit conditions improve, it is highly likely that business trends and GDP should remain constructive for the balance of 2011, reducing the probability of economic weakness developing. However, actual commercial & industrial loan activity lags the survey by 18 months and investors need to understand the differences in timing.
And the market concerns should be misguided:
Concerns about QE2 ending, higher energy prices and some moderation in ISM new orders miss the durability point. While the investment community may get distracted by the end of the Fed’s $600 billion in bond purchases this June, not to mention plausible softening in ISM new order figures from current elevated levels, the costs of corporate capital is far more crucial for determining capital spending programs as the return of investment capital is weighted against its cost. Indeed, worries with respect to higher gasoline prices undermining consumption should be offset by more jobs as a result of the eased lending standards. Thus, as the credit environment progresses more favorably, so should the decision making to generate returns.
Click on chart to enlarge, courtesy of Citigroup Global Markets.
Bears should be disappointed? Well, if not Loan Demand, Not Credit, Is The Problem ... and some price issues ...
Credit conditions remain critical for business investment and economic activity. The latest senior loan officers survey released by the Federal Reserve Board shows further easing in loan standards during 2Q11 (including those for small business and consumers) which has been a powerful nine-month lead indicator for investments in human, physical and working capital. As credit conditions improve, it is highly likely that business trends and GDP should remain constructive for the balance of 2011, reducing the probability of economic weakness developing. However, actual commercial & industrial loan activity lags the survey by 18 months and investors need to understand the differences in timing.
And the market concerns should be misguided:
Concerns about QE2 ending, higher energy prices and some moderation in ISM new orders miss the durability point. While the investment community may get distracted by the end of the Fed’s $600 billion in bond purchases this June, not to mention plausible softening in ISM new order figures from current elevated levels, the costs of corporate capital is far more crucial for determining capital spending programs as the return of investment capital is weighted against its cost. Indeed, worries with respect to higher gasoline prices undermining consumption should be offset by more jobs as a result of the eased lending standards. Thus, as the credit environment progresses more favorably, so should the decision making to generate returns.
Click on chart to enlarge, courtesy of Citigroup Global Markets.
Bears should be disappointed? Well, if not Loan Demand, Not Credit, Is The Problem ... and some price issues ...
Wednesday, April 27, 2011
Ben Decided To Run Real-Time Tests On Philips Curve
Obvious hype was the Ben's Press event today, while FOMC statement was taken neutral, for example, by Swedish SEB. Interestingly, Ben appears to be running a real-time test of Philips Curve, while Fed's staff raises inflation expectations and downgrades the real growth outlook ...
Thursday, April 21, 2011
Fed's "Masochism"? Well, Sadism
These charts from economists at BNP Paribas tell the bitter story. Click on charts to enlarge, courtesy of BNP Paribas.
Enjoy the long Easter holiday!
Monday, April 18, 2011
S&P Makes Indecent Reminder The US Has A Debt
S&P shrugs off the fear of being black-listed at all US intelligence services and to gain the ranks in status of public enemy by cutting the outlook for US credit rating to be negative. Reuters points to federal budget deficit ... The total debt of US still sits at mind-blowing heights, while the public money is being spent on bailing out reckless risk takers, feeding the commodity inflation and other God's works.
Click on chart to enlarge, courtesy of Bank Degroof.
Well, risk assets took a minor beating today. Was it in fear of more pragmatic government spending?
Click on chart to enlarge, courtesy of Bank Degroof.
Well, risk assets took a minor beating today. Was it in fear of more pragmatic government spending?
Subscribe to:
Posts (Atom)