As prescribed by Ben, I feel good and confident, and committed to contribute my share to struggling "economies" of Porsche, LVMH, PPR, Richemont ...
Though, the confidence does not change the annual revenues from investment in equities so quickly, therefore the gains will be realized by selling ...
Friday, November 05, 2010


Thursday, November 04, 2010
Equity Bull Already Talking About Career Risk & Cognitive Dissonance?
I did look at US equities in terms of EURo couple of days ago, and we may experience a bullish breakout, but so far the screaming US equity bull is deluding himself in terms of debased US dollar. I already hear the talk of career risk and cognitive dissonance. Interestingly, but bonds have been the best performing asset class for a global investor in terms of major currencies so far this year, even for USD based investor.
Click on charts to enlarge, courtesy of Jan Bylov, Nordea Markets. Asset class performance in USD.

Asset class performance in EUR.

Asset class performance in JPY. Note, that Japanese are making loss in all global asset classes, but would have been even better off by sticking with domestic zero yielding cash.
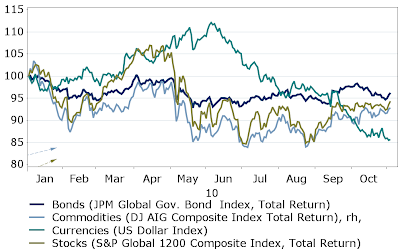
Asset class performance in terms of SDR basket.

Click on charts to enlarge, courtesy of Jan Bylov, Nordea Markets. Asset class performance in USD.

Asset class performance in EUR.

Asset class performance in JPY. Note, that Japanese are making loss in all global asset classes, but would have been even better off by sticking with domestic zero yielding cash.

Asset class performance in terms of SDR basket.

Everyone should be negative about USD?
Wednesday, November 03, 2010
The Fed Makes 4% Of Nominal GDP Ponzi-fied Easy
The Fed had to say something today, but everyone knows how many miles they are behind the curve. QE2 broadly in line with expectations of 4% nominal GDP ponzified easy.

Nice Reminders From The Chartology Experts At UBS
While we all await the announcement of QE2 monster, let' s look at some perspectives via charts prepared by technical analysts at UBS.
This seems to be the pattern markets try to follow right now, with short memories. Click on charts to enlarge, courtesy of UBS.

This is the Dow Jones decennial cycle.
 This is how secular bear markets play out, but note that 70ties were structurally different via high inflation.
 I stick to Japanese candle-stick masters, so far ... that assumes a correction to see how strong the bulls are. But that may change quickly.
This seems to be the pattern markets try to follow right now, with short memories. Click on charts to enlarge, courtesy of UBS.

This is the Dow Jones decennial cycle.


Tuesday, November 02, 2010
Look At US Equity Bull In Terms Of More Serious Currency
There is a lot of excitement in the US about the stock market performance lately. However, I decided to look at US equities in EURo terms, and not the US dollar that is supposed to be "quantitatively easyfied" again.
This is MSCI USA Standard Core Net Index in EUR, courtesy of MSCI. Click on chart to enlarge.
 While a lot of bullishness just before breaking out in terms of more serious currency, the technicals are "rolling over". While true bulls may continue to advance ...
This is MSCI USA Standard Core Net Index in EUR, courtesy of MSCI. Click on chart to enlarge.

Growth Is Back In Baltic Depression Economies
Latest take on Baltic Rim by Nordea available here! The epicenter of turmoil has a lot still to do, according to Swedbank.
Monday, November 01, 2010
Monetary Base And Yields & S&P500 In USA 1927-1946
High Priest of Keynesian school Paul Krugman runs a story of QE In The GD today. And for hose who study also history of more than 10 years ago it is clear that US defaulted on its obligations by suspending gold standard in 1930-ties, and did Quantitative Easing.
However, equities failed to appreciate during second expansion of monetary base, while 10 year Treasury yields continued to move down in 1930ties. Take a look at charts below, prepared by SEB's x-asset team, click to enlarge.
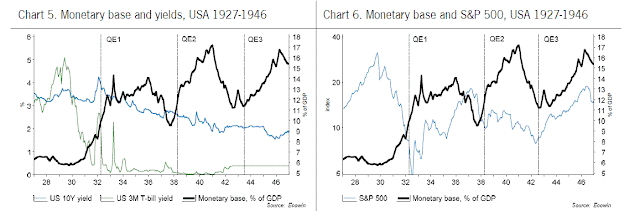 For inquiring minds the question of "WHY?" should arise. Well, the same Paul Krugman provided the explanation using accounting identities?:
However, equities failed to appreciate during second expansion of monetary base, while 10 year Treasury yields continued to move down in 1930ties. Take a look at charts below, prepared by SEB's x-asset team, click to enlarge.

The process of paying down debt, however, must obey two rules:
1. Those who pay down debt must do so by spending less than their income.
2. For the world as a whole, spending equals income.
It follows that
3. Those who are not being forced to pay down debt must spend more than their income.
But here’s the problem: there’s no good mechanism in place to induce those who can spend more to do so. Low interest rates do encourage spending; but given the size of the debt shock, even zero rates are nowhere near low enough.
So since the world economy can’t raise the bridge, it is lowering the water: without sufficient spending from those who can, the only way to make the accounting identities hold is for incomes to decline — specifically, the incomes of those not constrained by debt must decline so as to create a sufficiently large gap between their (unchanged) spending and their incomes to offset the forced saving of debtors. Of course, the mechanism here is an overall global slump, so the debtors are squeezed as well, forced into even more painful cuts.
Mother Of All Chinese Recoveries
For the 3rd month in a row Chinese manufacturing PMI surprises to the upside, with new orders marching on and low finished goods inventory there are good prospects for manufacturing expansion ahead. Liquidity drives every bear out of caves now.
The strategists at CLSA Asia-Pacific Markets had pretty nice charts more than a week ago on what drives China with a following explanation:

While net exports are playing a minor role for the growth now, export industries employ very substantial part of workforce ...
The strategists at CLSA Asia-Pacific Markets had pretty nice charts more than a week ago on what drives China with a following explanation:
INVESTMENT remains the most important driver of China.s GDP growth, in part because the Communist Party decided that it could afford to undertake a massive build-out of public infrastructure, which is intended to boost productivity and reduce income inequality . . . and encourage citizens to like the Party. During the first nine months of this year, investment accounted for 58.8% of GDP growth, or 6.3ppts of 10.6% YoY growth. In 2009, investment, boosted by a huge stimulus program, accounted for 95.2% of GDP growth, or 8.7ppts of 9.1% YoY growth. During the period 2006-08, prior to the stimulus, investment accounted for 43-48% of growth.Click on charts to enlarge, courtesy of CLSA Asia-Pacific Markets.
FINAL CONSUMPTION accounted for 34.4% of GDP growth in the first three quarters of this year, or 3.6ppts of 10.6% YoY growth. This is the smallest consumption share of growth since 1994, despite 18% nominal retail sales growth this year, because investment continued to rise strongly off of a large base. Last year, final consumption (of which, about 27% is government consumption) accounted for 45.4% of GDP growth, or 4.1ppts of 9.1% YoY growth. Prior to the stimulus, the consumption share of growth had risen from 39% in 2007 to 45% in 2009.
NET EXPORTS are the least important driver of China.s economy, contributing 6.8% of growth so far this year, or 0.7ppts of 10.6% YoY GDP growth. Last year, the collapse in global demand left net exports delivering a huge negative drag on growth, with a -40.6% contribution, or -3.7ppts of 9.1% YoY GDP growth. From 2001, when China joined the WTO, through 2008, the average annual net export contribution to GDP growth was 10.3%. This year and in 2011, we forecast a zero contribution to full year growth.

While net exports are playing a minor role for the growth now, export industries employ very substantial part of workforce ...
Friday, October 29, 2010
Wrong Focus On Real GDP This Time?
While I would measure a recovery how we are performing compared to the previous peak, and not from the recession trough ... just because the loss is from peak. However, Jim Reid and his team at Deutsche Bank have the following story for us again today:


We think that nominal GDP is far more important in this cycle than real GDP and the Fed is seemingly starting to agree. It's important because with overall US economy debt/GDP at absurdly high levels, the economy is shock prone for as long as you run such a system. A low level of nominal GDP growth only erodes the burden very slowly leaving us exposed even if real GDP is running at broadly normal post recovery levels. In fact we would argue that nominal GDP needs to be running at higher than average levels due to the argument discussed above and the fact that it fell more than it did in all but one of the previous post-WWII recessions. For us this is why we've always felt that QE will be with us for many years. Until the debt/GDP returns back to more sustainable/normal levels we think the pressure will be on the authorities to effective print money to ease the potentially destabilising deleveraging process. We can't help but think that QE2 won't be the last episode of QE.
Click on charts to enlarge, courtesy of Deutsche Bank.Anyway onto the evidence. The first graph shows every post-WWII recovery in nominal terms from the trough in activity (end June 09 in the latest case). We've rebased the trough at 100 and tracked each subsequent quarter's activity. At the end of the last quarter this current recovery was running pretty much neck and neck with the 2001-02 episode as the weakest of the 13 post-war nominal recoveries. If the number comes in as expected today (2% real, 1.8% price deflator) then the graph shows that we'll move away from it being the worst nominal recovery but it will still be one of the weakest and well below average. The second graph shows the prior drop in nominal activity from the start of each recession to the trough. Of the 13 recessions since WWII, 5 have seen a fall in nominal activity and this latest downturn was the second biggest. So not only was this a big fall relative to history but the subsequent recovery has been one of the weakest. In normal times the more things fall the more they recover. This is why this cycle is different in our opinion. We desperately need more nominal GDP growth to grow out of our problems and this is why the Fed will try to inject fresh impetus into the economy next week. Whether it eventually works is a moot point but this for us is the reason it is being attempted.


Subscribe to:
Posts (Atom)