I am back, but I cannot promise the posting will be regular going forward.
My "focus list" consisting of Spanish and Italian bonds, and JPY worked well, however all of those instruments have experienced interventions by central banks and cannot be considered as leading indicators anymore.
The liquidity crisis usually resolves with a victim, and while none of fundamental macro problems have been solved, the liquidity will just postpone the resolution.
However, for the greedy people we all are, I would be still cautious beyond the obvious speculative action. Danske Bank had a good reminder yesterday, see the picture below, but you decide whether the witch-hunt has ended.
Click on picture to enlarge, courtesy of Danske Bank Markets.
Showing posts with label US. Show all posts
Wednesday, August 24, 2011
Monday, July 04, 2011
Credit Agricole: Sisyphus Cannot Simply Kick The Can Down The Road
Posting will be very light, or even absent in July. For the longer reading the latest macro prospects by Credit Agricole are at your disposal here.
Thursday, June 30, 2011
Second Anniversary Of Impossible Equation
With the second round of "Greek bail-outs" already passed the "feel good" kicking of the can down the road goes on. However, I return to history that has second anniversary today, when I singled out the report by Societe Generale and posted on this blog SocGen: Public Finances - The Impossible Equation two years ago. The first anniversary I remembered with Anniversary Of Impossible Equation. But how far have we got today?
As Keynes noted:
"In the long run we are all dead."
Anyway?
As Keynes noted:
"In the long run we are all dead."
Anyway?
Wednesday, June 29, 2011
Liquidity Glut And Low Interest Rates
I have been writing about liquidity glut and low interest rates, and their impact on real economy some time ago. Gerard Minack, the strategist at Morgan Stanley, brings up this issue today and makes it very clear, again:
Exhibit 1 shows the contribution to the 12 month return on US equities from the change in the prospective PE ratio (the PE based on consensus earning forecasts). The amplitude is significant: the swing in the PE often contributed plus or minus 20-30 percentage points to the annual equity return. Importantly, the biggest influence on the PE ratio was interest rates. Falling rates led to a rising PE, and vice versa. (The line in the chart is the 12 month change in the 10 year Treasury yield – but it is inverted: so the line goes up as yields go down.)
Click on chart to enlarge, courtesy of Morgan Stanley.
Well, the times may be changing, as Gerard Minack continues:
This was the basis for the ‘don’t fight the Fed’ mantra. In a credit super cycle – when investors are willing to increase borrowing as rates fall – lower rates are good for risk assets.
A post-bubble environment is different. As I’ve discussed before, macro cycles tend to be weaker and more fragile. As importantly, investors do not respond to lower rates in the same way as they did through the credit super-cycle.
On a days like today it feels like bubble never ended? Some evidence of global stabilisation?
Exhibit 1 shows the contribution to the 12 month return on US equities from the change in the prospective PE ratio (the PE based on consensus earning forecasts). The amplitude is significant: the swing in the PE often contributed plus or minus 20-30 percentage points to the annual equity return. Importantly, the biggest influence on the PE ratio was interest rates. Falling rates led to a rising PE, and vice versa. (The line in the chart is the 12 month change in the 10 year Treasury yield – but it is inverted: so the line goes up as yields go down.)
Click on chart to enlarge, courtesy of Morgan Stanley.
Well, the times may be changing, as Gerard Minack continues:
This was the basis for the ‘don’t fight the Fed’ mantra. In a credit super cycle – when investors are willing to increase borrowing as rates fall – lower rates are good for risk assets.
A post-bubble environment is different. As I’ve discussed before, macro cycles tend to be weaker and more fragile. As importantly, investors do not respond to lower rates in the same way as they did through the credit super-cycle.
On a days like today it feels like bubble never ended? Some evidence of global stabilisation?
Tuesday, June 21, 2011
Nomura: How Much Of A US Slowdown Is In The Price?
Interesting observations by strategists at Nomura today:
While June ISM risks are skewed to the downside, growth-related assets seem to be underestimating the possibility of a disappointing outcome. Figure 1 compares the ISM index with the year-on-year changes in our common measure of US market-implied growth, which we define as the first component of a PCA on a group of US growth-related assets. It is apparent that after months of relative pessimism the market is now trying to look through the recent data and view it as a transitory slowdown. As such, growth assets appear vulnerable to further disappointing data in June. Currently, on this simplistic measure the market implies an ISM of roughly 57.0 vs our economists forecast of 51.8 and the Philly Fed's dismal ISM-equivalent reading of 45.5.
While buying Treasuries and selling stocks would be the natural trade to position for a deeper-than-expected ISM dip, optimising this trade could be key given current valuations. Figure 2 looks at the relative mispricing of each asset with respect to the common US growth component. Clearly, while Treasuries would benefit from a disappointing growth outcome, yields already appear too low compared with the rest of the assets in our universe and arguably offer only a limited reward. Conversely, S&P Consumer services, oil and copper still appear too optimistic with respect to growth, despite their recent retrenchment, and thus offer an interesting trade for investors positioning for a longer and deeper "soft patch" than currently expected.
Click on charts to enlarge, courtesy of Nomura.
Well, markets seem to be focused on "technically oversold" conditions and Greek "victory" today...
While June ISM risks are skewed to the downside, growth-related assets seem to be underestimating the possibility of a disappointing outcome. Figure 1 compares the ISM index with the year-on-year changes in our common measure of US market-implied growth, which we define as the first component of a PCA on a group of US growth-related assets. It is apparent that after months of relative pessimism the market is now trying to look through the recent data and view it as a transitory slowdown. As such, growth assets appear vulnerable to further disappointing data in June. Currently, on this simplistic measure the market implies an ISM of roughly 57.0 vs our economists forecast of 51.8 and the Philly Fed's dismal ISM-equivalent reading of 45.5.
While buying Treasuries and selling stocks would be the natural trade to position for a deeper-than-expected ISM dip, optimising this trade could be key given current valuations. Figure 2 looks at the relative mispricing of each asset with respect to the common US growth component. Clearly, while Treasuries would benefit from a disappointing growth outcome, yields already appear too low compared with the rest of the assets in our universe and arguably offer only a limited reward. Conversely, S&P Consumer services, oil and copper still appear too optimistic with respect to growth, despite their recent retrenchment, and thus offer an interesting trade for investors positioning for a longer and deeper "soft patch" than currently expected.
Click on charts to enlarge, courtesy of Nomura.
Well, markets seem to be focused on "technically oversold" conditions and Greek "victory" today...
Monday, June 20, 2011
Bonds Outperforming Equities
Well, this was initiated couple of months ago. Mary Ann Bartels et al. at BofA Merrill Lynch paints the bigger picture of equities versus bonds, and note today:
From a mid February high, the stocks vs. bonds ratio has corrected and is testing the rising 200-day moving average.
There are not yet any firm bottoming signs for stocks relative to bonds. This suggests that stocks should continue to underperform bonds in coming days/weeks.
Click on chart to enlarge, courtesy of BofA Merrill Lynch.
Should we assume we move towards the bottom of the channel?
From a mid February high, the stocks vs. bonds ratio has corrected and is testing the rising 200-day moving average.
There are not yet any firm bottoming signs for stocks relative to bonds. This suggests that stocks should continue to underperform bonds in coming days/weeks.
Click on chart to enlarge, courtesy of BofA Merrill Lynch.
Should we assume we move towards the bottom of the channel?
Thursday, June 16, 2011
Jump In Correlations In European Credit Markets
The message from credit strategists at BNP Paribas today:
A confluence of events has increased volatility which could turn systemic in nature. With correlations bunching up once again and trending towards 1.0, the message from the markets is loud and clear that systemic risk is rising and liquidity is poor, which is being reflected in higher volatility and risk premia.
Click on chart to enlarge, courtesy of BNP Paribas.
If this is not enough, one should consider - what has made US markets "so weak" recently?
Click on chart to enlarge, courtesy of BNP Paribas.
Well, ECRI tells us not to blame Japan for slowdown ...
A confluence of events has increased volatility which could turn systemic in nature. With correlations bunching up once again and trending towards 1.0, the message from the markets is loud and clear that systemic risk is rising and liquidity is poor, which is being reflected in higher volatility and risk premia.
Click on chart to enlarge, courtesy of BNP Paribas.
If this is not enough, one should consider - what has made US markets "so weak" recently?
Click on chart to enlarge, courtesy of BNP Paribas.
Well, ECRI tells us not to blame Japan for slowdown ...
DBS Sees "Summer Lull A Window Of Opportunities" For Asia Equities
DBS came out with latest Asset Allocation report today, as for Asian equities the view is more than clear:
• The short-term ebbs and flows we are currently experiencing are nothing but a proverbial 'tempest in a tea cup'. Financial instability in Europe and an economic soft patch in the US heighten risks, but not enough to derail the ongoing global recovery
• Volatility and mixed data signals are the norm at this stage of the cycle. We find comfort in attractive valuations, supported by realistic earnings growth expectations. Asian equities as an asset class are cheap relative to cash and inflation
• Asian markets probably bottomed at the end of March and should end the year comfortably higher than current levels. The passing of QE2 is unlikely to be a big event. The associated risks are rising bond yields and capital outflow in the early part of 3Q. We believe the stage is set for a 2H rally after the removal of this overhang.
• We are maintaining our Overweight recommendation in Taiwan, Malaysia and Indonesia whilst Thailand is downgraded to Underweight. China, Hong Kong and India are still Underweight. Korea is upgraded to Neutral.
So, the window of opportunity may close soon, or be the wall to hit soon in full speed.
Stunning difference, that is very obvious in the picture below, creates views like this:
Click on chart to enlarge, courtesy of DBS.

Well, there are views that the "main determinant of its own fate" may face serious problems of rebalancing ...
• The short-term ebbs and flows we are currently experiencing are nothing but a proverbial 'tempest in a tea cup'. Financial instability in Europe and an economic soft patch in the US heighten risks, but not enough to derail the ongoing global recovery
• Volatility and mixed data signals are the norm at this stage of the cycle. We find comfort in attractive valuations, supported by realistic earnings growth expectations. Asian equities as an asset class are cheap relative to cash and inflation
• Asian markets probably bottomed at the end of March and should end the year comfortably higher than current levels. The passing of QE2 is unlikely to be a big event. The associated risks are rising bond yields and capital outflow in the early part of 3Q. We believe the stage is set for a 2H rally after the removal of this overhang.
• We are maintaining our Overweight recommendation in Taiwan, Malaysia and Indonesia whilst Thailand is downgraded to Underweight. China, Hong Kong and India are still Underweight. Korea is upgraded to Neutral.
So, the window of opportunity may close soon, or be the wall to hit soon in full speed.
Stunning difference, that is very obvious in the picture below, creates views like this:
Asian demand is the main determinant of its own fate
Click on chart to enlarge, courtesy of DBS.

Well, there are views that the "main determinant of its own fate" may face serious problems of rebalancing ...
Tuesday, June 14, 2011
Just In Case You Thought QE2 Is Already Priced In
The strategists at Societe Generale think that QE2 is NOT priced in yet, and paint a picture of what lies ahead.
Click on charts to enlarge, courtesy of Societe Generale.
Indeed, it may be far from "worst is over" until capitulation sets in ...
Click on charts to enlarge, courtesy of Societe Generale.
Indeed, it may be far from "worst is over" until capitulation sets in ...
No Capitulation For Merrill's Fund Managers
They were about Fading Or Risking last month, this month key messages from BofA Merrill Lynch Global Fund Manager Survey are as follows:
No capitulation... no QE3
In the June FMS investors raised cash, reduced risk asset exposure and rotated to defensive sectors. But investor panic is not yet visible. The recent drop in global growth expectations stabilized and despite sharply lower inflation readings, two-thirds of investors predict no QE3.
Growth expectation stabilise
Growth and profit expectations stabilised after recent sharp falls. Inflation expectations fell to 38% from 69% two months ago. But the macro backdrop is not seen as weak enough to warrant more stimulus: three out of four panellists think a recession unlikely and only 13% expect a new round of QE in H2.
Risk is off
The percentage of investors OW cash rose to 21%, the highest since July-09. Actual cash balances rose from 3.9% to 4.2% but this did not trigger a buy signal from our trading rule. Hedge funds cut gearing levels sharply to 1.27x from 1.53x while 43% of investors believe EU sovereign debt funding is the biggest "tail risk". Overall our risk & liquidity index fell to 38, below its long term average of 40.
Gold overvaluation highest since 2009
Equity allocations fell, benefiting bonds and cash, but positioning overall stands in the middle of historic ranges. Note that the gold price is seen as more overvalued than at anytime since Dec-09 while commodity allocations again fell.
Japan remains most unloved market
Despite China growth expectations dropping to the lowest reading since Jan-09, EM remains the most preferred region for equities, pipping the US. Regional allocations show a big drop in exposure to Eurozone and UK equities but Japan remains the most unloved equity region.
Bank underweight most negative since March 2009
Contrarians note that the weighting in global banks fell to its lowest since March 2009. Consumer discretionary saw the largest monthly drop in exposure with the only positive sector moves coming from defensives. Tech remains the most popular sector followed by pharma and energy.
Contrarian trades...
Despite no contrarian "buy" signal for risk being triggered, the contrarian trades within the June FMS are: long banks, short gold; long Japanese banks, short US tech; long Eurozone, short EM; long US dollar, short Japanese yen.
Click on chart to enlarge, courtesy of BofA Merrill Lynch.
I have no intention to be contrarian this month ...
No capitulation... no QE3
In the June FMS investors raised cash, reduced risk asset exposure and rotated to defensive sectors. But investor panic is not yet visible. The recent drop in global growth expectations stabilized and despite sharply lower inflation readings, two-thirds of investors predict no QE3.
Growth expectation stabilise
Growth and profit expectations stabilised after recent sharp falls. Inflation expectations fell to 38% from 69% two months ago. But the macro backdrop is not seen as weak enough to warrant more stimulus: three out of four panellists think a recession unlikely and only 13% expect a new round of QE in H2.
Risk is off
The percentage of investors OW cash rose to 21%, the highest since July-09. Actual cash balances rose from 3.9% to 4.2% but this did not trigger a buy signal from our trading rule. Hedge funds cut gearing levels sharply to 1.27x from 1.53x while 43% of investors believe EU sovereign debt funding is the biggest "tail risk". Overall our risk & liquidity index fell to 38, below its long term average of 40.
Gold overvaluation highest since 2009
Equity allocations fell, benefiting bonds and cash, but positioning overall stands in the middle of historic ranges. Note that the gold price is seen as more overvalued than at anytime since Dec-09 while commodity allocations again fell.
Japan remains most unloved market
Despite China growth expectations dropping to the lowest reading since Jan-09, EM remains the most preferred region for equities, pipping the US. Regional allocations show a big drop in exposure to Eurozone and UK equities but Japan remains the most unloved equity region.
Bank underweight most negative since March 2009
Contrarians note that the weighting in global banks fell to its lowest since March 2009. Consumer discretionary saw the largest monthly drop in exposure with the only positive sector moves coming from defensives. Tech remains the most popular sector followed by pharma and energy.
Contrarian trades...
Despite no contrarian "buy" signal for risk being triggered, the contrarian trades within the June FMS are: long banks, short gold; long Japanese banks, short US tech; long Eurozone, short EM; long US dollar, short Japanese yen.
Click on chart to enlarge, courtesy of BofA Merrill Lynch.
I have no intention to be contrarian this month ...
Monday, June 13, 2011
Barclays On US Deflation Risks
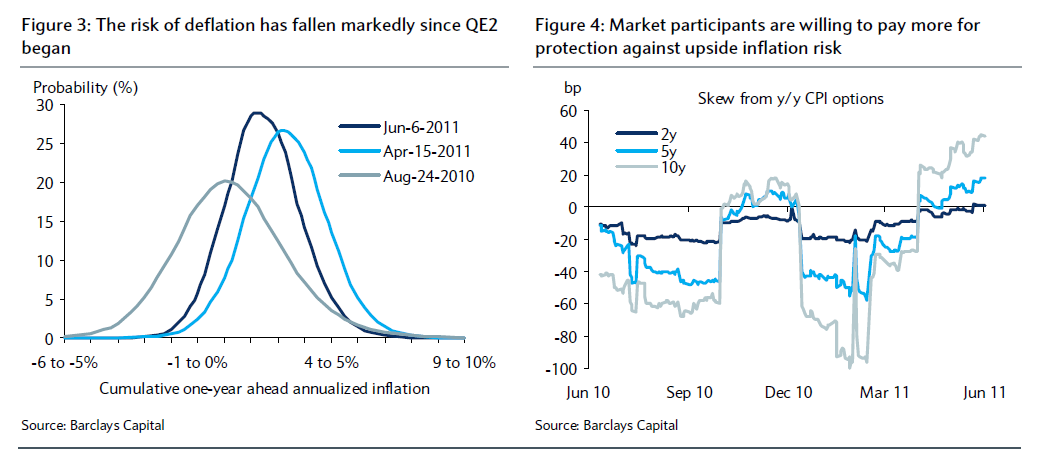
While the equity investors like the industrialists of Weimar Republic are awaiting for the first hints of QE3 by Fed, I was a bit surprised that the risk of deflation appears like a distant probability. Here the latest take by economists at Barclays Capital:
The increase in inflation and inflation expectations has also coincided with a reduction in deflation risk. Figure 3 shows the probability of cumulative inflation over a one-year horizon using information from both TIPS and CPI options data. The figure shows that the probability of deflation over the one-year ahead horizon in August of last year was 36%. When 5y5y breakeven inflation reached its recent high in April of this year, the probability had fallen to about 3%. Currently, it stands at about 7%. In addition, Figure 4 shows that the market remains more willing to pay for protection against upside inflation risks than protection against excessive deflation risk. The figure plots the difference in premiums paid on +200bp out-of-the-money inflation caps and -200bp out-of-the-money inflation floors for different horizons. Because an inflation cap pays off when cumulative inflation exceeds the threshold specified in the contract, a positive reading is an indication that the caps are more expensive than the floors; in other words, the market sees the distribution of expected inflation as skewed in the direction of upside inflation risk. The trends from CPI options markets suggest that skew has been moving in the direction of willingness to pay for protection against upside inflation risk, whereas for much of last year, participants were willing to pay more for protection against deflation.
Altogether, we see the trends in inflation markets as consistent with Chairman Bernanke’s comments in his April press conference that the balance of risks between seeking additional progress on its dual mandate relative to further balance sheet expansion was “less attractive” than it was a year earlier. We therefore see the Fed as inclined to remain patient. If incoming data confirm the Fed’s view that the economy is turning up in the second half of the year, the FOMC will likely continue on its path towards normalizing the policy stance. However, if the recovery fails to regain momentum, the balance of risks may shift back in favor of further Fed action.
Click on charts to enlarge, courtesy of Barclays Capital.
Well, just in case ... "if the recovery fails to regain momentum". Why it should?
The increase in inflation and inflation expectations has also coincided with a reduction in deflation risk. Figure 3 shows the probability of cumulative inflation over a one-year horizon using information from both TIPS and CPI options data. The figure shows that the probability of deflation over the one-year ahead horizon in August of last year was 36%. When 5y5y breakeven inflation reached its recent high in April of this year, the probability had fallen to about 3%. Currently, it stands at about 7%. In addition, Figure 4 shows that the market remains more willing to pay for protection against upside inflation risks than protection against excessive deflation risk. The figure plots the difference in premiums paid on +200bp out-of-the-money inflation caps and -200bp out-of-the-money inflation floors for different horizons. Because an inflation cap pays off when cumulative inflation exceeds the threshold specified in the contract, a positive reading is an indication that the caps are more expensive than the floors; in other words, the market sees the distribution of expected inflation as skewed in the direction of upside inflation risk. The trends from CPI options markets suggest that skew has been moving in the direction of willingness to pay for protection against upside inflation risk, whereas for much of last year, participants were willing to pay more for protection against deflation.
Altogether, we see the trends in inflation markets as consistent with Chairman Bernanke’s comments in his April press conference that the balance of risks between seeking additional progress on its dual mandate relative to further balance sheet expansion was “less attractive” than it was a year earlier. We therefore see the Fed as inclined to remain patient. If incoming data confirm the Fed’s view that the economy is turning up in the second half of the year, the FOMC will likely continue on its path towards normalizing the policy stance. However, if the recovery fails to regain momentum, the balance of risks may shift back in favor of further Fed action.
Click on charts to enlarge, courtesy of Barclays Capital.
Well, just in case ... "if the recovery fails to regain momentum". Why it should?
Monday, June 06, 2011
On Hiatus This Week
The bulls(hitters) have it difficult to defend the technical support levels around 1295 for S&P500 today.
Click on chart to enlarge, courtesy of StockCharts.com (click on link for up-to-date version).
Sometimes bulls like cheaper prices, like March lows, for example ...
Click on chart to enlarge, courtesy of StockCharts.com (click on link for up-to-date version).
Sometimes bulls like cheaper prices, like March lows, for example ...
Friday, June 03, 2011
Corporate Profits & Margins At Record High Vs Real Wages
Well, let's put them both in confrontation - record high corporate profits and margins versus real wages. Then, this is the part of Keynes I believe in, while otherwise the problems have been created because we have departed from, sort of, "Austrian" school:
Business doesn’t invest and hire because they feel good, they invest and hire because they think someone will buy what they are making and selling.
There is a substantial downside for riches, as Keynes speak "Austrian". Debt destruction will lead to savings destruction, that will in turn require more savings and less consumption.
Business doesn’t invest and hire because they feel good, they invest and hire because they think someone will buy what they are making and selling.
There is a substantial downside for riches, as Keynes speak "Austrian". Debt destruction will lead to savings destruction, that will in turn require more savings and less consumption.
More Than 1000 Words Can Tell
The Blogosphere went on to look at US real wage growth today, e.g., comparing it to Great Depression, but has been my focus for a while already. Well, a nice picture from the team of Chris Wood at CLSA Asia-Pacific Markets yesterday.
Click on chart to enlarge, courtesy of CLSA Asia-Pacific Markets.
We need more stimulus, to drive trend consumption that was driven by debt bubble ...
Click on chart to enlarge, courtesy of CLSA Asia-Pacific Markets.
We need more stimulus, to drive trend consumption that was driven by debt bubble ...
Thursday, June 02, 2011
Chart Of The Day
While media still wonders around economic surprises, and I did it very clear a month ago, we move on to chart of the day, this time from credit strategists at BNP Paribas. No comment, brrrrr.
Click on chart to enlarge, courtesy of BNP Paribas.
Wednesday, June 01, 2011
Chinese Holes
While the markets digest the bearish PMIs/ISM reports, with the weakness attributed to Japanese earthquake, I am looking elsewhere today. Actually, my mind is in China, again.
Today I list some of the "Holes in the bull argument" written by property analysts at Credit Suisse on Monday:
■ Credit Suisse proprietary surveys on banks, construction companies and unlisted developers showed no light at the end of the tunnel. Banks’ lending has become much more pragmatic, and the well-accepted perception of favouritism on SOEs may not be correct; many developers are delaying payments to construction companies, and taking private loans with interests beyond 20%—sector cash flow may get much worse soon.
■ ‘Rising salary’ may not solve China's housing affordability issue. Income growth targets and the proposed new income tax reform focus on low income class—the target customers for private housing may actually be worse off as a result.
■ The industry consolidation argument has neglected the impact to book value. Major listed developers only represent a fraction of China’s property market. The potential exodus of small developers could be overwhelming, and lowered land prices may force listed developers to adjust book value.
Click on chart to enlarge, courtesy of Credit Suisse.
By the way, China takes on its massive muni mess with a $463bn bailout, to start with ...
Today I list some of the "Holes in the bull argument" written by property analysts at Credit Suisse on Monday:
■ Credit Suisse proprietary surveys on banks, construction companies and unlisted developers showed no light at the end of the tunnel. Banks’ lending has become much more pragmatic, and the well-accepted perception of favouritism on SOEs may not be correct; many developers are delaying payments to construction companies, and taking private loans with interests beyond 20%—sector cash flow may get much worse soon.
■ ‘Rising salary’ may not solve China's housing affordability issue. Income growth targets and the proposed new income tax reform focus on low income class—the target customers for private housing may actually be worse off as a result.
■ The industry consolidation argument has neglected the impact to book value. Major listed developers only represent a fraction of China’s property market. The potential exodus of small developers could be overwhelming, and lowered land prices may force listed developers to adjust book value.
Click on chart to enlarge, courtesy of Credit Suisse.
By the way, China takes on its massive muni mess with a $463bn bailout, to start with ...
Monday, May 30, 2011
Chinese Imports Already Show Signs Of A Slowdown
I am entertaining myself with the chart below that comes from economists at Barclays Capital. We have had musings about the importance of Chinese growth story, also as a leading indicator for the global manufacturing cycle. Obviously, Chinese imports play here some role.
Click on chart to enlarge, courtesy of Barclays Capital.
The economists at Barclays Capital wrote on Friday:
... there are already signs of a slowdown in Chinese imports from the US and Europe.
Click on chart to enlarge, courtesy of Barclays Capital.
The economists at Barclays Capital wrote on Friday:
... there are already signs of a slowdown in Chinese imports from the US and Europe.
Thursday, May 26, 2011
BNP Paribas: US Bank Credit Has Underperformed Europe's
Indeed, interesting, brought to you by credit strategists at BNP Paribas today, my emphasis in bold and underlined:
It is interesting to note that while European bank paper (Senior and LT2) has widened on the back of sovereign concerns, US bank paper (Senior and LT2) has widened more over the last month due to housing double-dip, legal issues and relatively weaker economic environment. This US bank underperformance stresses two key points, namely that the GIP sovereign crisis is increasingly being seen as idiosyncratic and manageable while the US economic slowdown if sustained is likely to become a bigger issue in June.
Click on charts to enlarge, courtesy of BNP Paribas.
Well, let's see!
It is interesting to note that while European bank paper (Senior and LT2) has widened on the back of sovereign concerns, US bank paper (Senior and LT2) has widened more over the last month due to housing double-dip, legal issues and relatively weaker economic environment. This US bank underperformance stresses two key points, namely that the GIP sovereign crisis is increasingly being seen as idiosyncratic and manageable while the US economic slowdown if sustained is likely to become a bigger issue in June.
Click on charts to enlarge, courtesy of BNP Paribas.
Well, let's see!
Wednesday, May 25, 2011
Profit Margins Again
It just happens, as a follow-up on the post from yesterday, also the economists at BCA Research made their conclusions on the corporate profit margins yesterday. So, here some excerpts to consider:
Ultimately, the health of the corporate sector depends on the financial health of its customers. Thus, the divergence between rising profits and weak growth in real consumer incomes will have to change. Historically, the growth in real profits has been correlated closely with that of real consumer spending, and the wide gap in the current cycle represents a major aberration.
I have discussed the real consumer spending and especially the incomes that should drive that spending here earlier. So, here are the mains points about margins, according to BCA Research:
To conclude, the corporate sector has been enjoying a very favorable set of circumstances that will not persist. This does not mean that profit margins are about to plunge. Companies will remain intensely focused on cost control and boosting efficiency, and the weak dollar will continue to provide support to overseas earnings. However, it is hard to see margins moving higher from current levels in the coming year.
Margins and thus profits will face a severe challenge during the next recession. The ability to repeat this cycle’s aggressive cost cutting will be minimal, and pricing power will be under pressure. If we are going to have a mean reversion of margins, then that is when it will occur. A severe margin squeeze does not seem likely while the economy is still expanding.
All in all, not bad? Just imagine how much money has been thrown at non-existing problems. Save that challenge for next recession, while at least couple of bears were growling also today ...
Ultimately, the health of the corporate sector depends on the financial health of its customers. Thus, the divergence between rising profits and weak growth in real consumer incomes will have to change. Historically, the growth in real profits has been correlated closely with that of real consumer spending, and the wide gap in the current cycle represents a major aberration.
I have discussed the real consumer spending and especially the incomes that should drive that spending here earlier. So, here are the mains points about margins, according to BCA Research:
To conclude, the corporate sector has been enjoying a very favorable set of circumstances that will not persist. This does not mean that profit margins are about to plunge. Companies will remain intensely focused on cost control and boosting efficiency, and the weak dollar will continue to provide support to overseas earnings. However, it is hard to see margins moving higher from current levels in the coming year.
Margins and thus profits will face a severe challenge during the next recession. The ability to repeat this cycle’s aggressive cost cutting will be minimal, and pricing power will be under pressure. If we are going to have a mean reversion of margins, then that is when it will occur. A severe margin squeeze does not seem likely while the economy is still expanding.
All in all, not bad? Just imagine how much money has been thrown at non-existing problems. Save that challenge for next recession, while at least couple of bears were growling also today ...
Tuesday, May 24, 2011
Margins & Profit Shares At New All-Time Highs
Right, this is about our expectations, apparently. Gerard Minack at Morgan Stanley writes today:
The only way equities look cheap on a through-the-cycle earnings basis is if earnings are heading higher and stay higher (through the cycle). It so happens that the sell-side consensus expects this. It is forecasting 30% EPS growth over the next two years for developed world equities. This implies margins and profit shares at significant new all-time highs.
Click on chart to enlarge, courtesy of Morgan Stanley.
Well, at the end he made the conclusion as follows:
But the bigger-picture point is that equities have priced in a higher structural range for earnings. Equities may be cheap if earnings move into a new, even higher range. Otherwise, they appear expensive or very expensive.
Unusually bearish for sell-side consensus?
The only way equities look cheap on a through-the-cycle earnings basis is if earnings are heading higher and stay higher (through the cycle). It so happens that the sell-side consensus expects this. It is forecasting 30% EPS growth over the next two years for developed world equities. This implies margins and profit shares at significant new all-time highs.
Click on chart to enlarge, courtesy of Morgan Stanley.
Well, at the end he made the conclusion as follows:
But the bigger-picture point is that equities have priced in a higher structural range for earnings. Equities may be cheap if earnings move into a new, even higher range. Otherwise, they appear expensive or very expensive.
Unusually bearish for sell-side consensus?
Subscribe to:
Posts (Atom)