Monday, May 31, 2010

Contemporary Art Of Bull Trend ...

Highly rated technical analysts headed by Achim Matzke at Commerzbank painted the technical picture last week:
Against the backdrop of the medium-term overbought situation, the index has recently left the bull market trend with a take-profit signal and has also broken through the still-rising 200-day m.a. on its way down. As the slump in price is already over 10%, this is a correction in the technical sense, the first in this bull market cycle. The correction is limited on the one hand by the support at c. 1,045 points and on the other by the staggered resistance zone at 1,200-1,250. A trading market should emerge within this price range in the coming weeks. Only when the S&P 500 falls below the zone at c. 1,045 should further, medium-term technical clouding be expected.
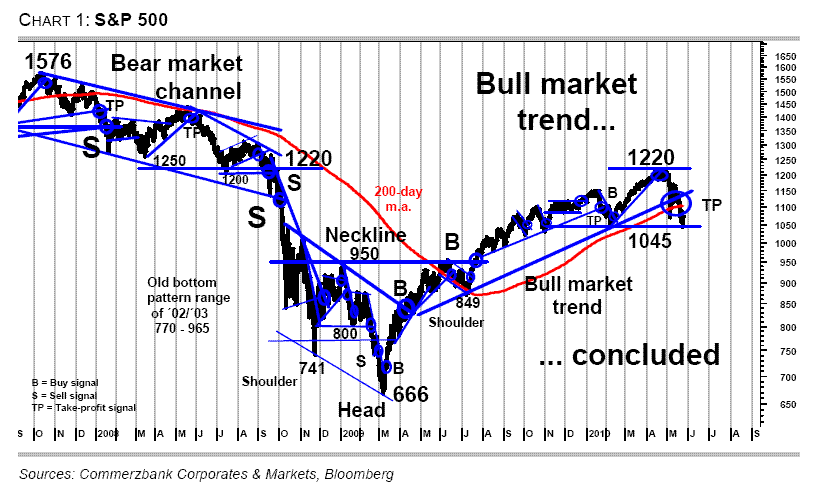
Click on chart to enlarge, courtesy of Commerzbank.
Global strategists at Nomura are "pressing" on the sentiment and "improving fundamentals" over the weekend, what they summarize as follows:

We think the past two weeks have seen capitulation by equity investors as sentiment reached a historical low.

The past two weeks saw net outflows of US$24bn from global equity mutual funds – the second-largest weekly outflow over the history of our series.

Put-call ratios are at levels close to those reached in September 2008, reflecting extremely depressed sentiment.

Surveys of sentiment like the Investors Intelligence survey and the AAII bull-bear
survey also portray bearish sentiment, though not to the same extremes.

We think depressed sentiment should be another supportive factor for equities, apart from improving fundamentals.

Sentiment is more depressed in Europe than in the US, which is not surprising. However, we think the sell-off in Continental Europe is overdone and recommend overweighting the market relative to the US.

We believe investors are not paying sufficient attention to the improving fundamentals, with attractive relative valuations and better earnings prospects because of the lower euro.

Though, Christopher Wood at CLSA Asia-Pacific Markets was less enthusiastic last Thursday:

But GREED & fear’s view is that the risk trade, for now, is more likely to remain off rather than on. That suggests a posture of selling rallies rather than buying dips.
Click on chart to enlarge, courtesy of CLSA Asia-Pacific Markets.


So, selling the rallies?

Friday, May 28, 2010

Cannot Get Eyes Off The Spanish Sovereign Spread

Despite the rally in risk assets in the last couple of days, and the QE by ECB ... my eyes "watch the strength" of Spanish sovereign spread. Click on chart below, Spanish 5 year benchmark bond over Germany, data courtesy of Reuters.

Jim Reid, the strategist at Deutsche Bank, explains today:

... but if we only had to look at one thing we'd probably keep it simple and look at peripheral Sovereign spreads. The reason for this is that this is the market we have to stabilise before we can put this stage of what will be an ongoing crisis to bed.

It must be disappointing to both the market and the authorities that 5yr peripheral CDS spreads for example are now pretty much at identical levels to where they were around the time of the Trillion Dollar bail-out package 3 weeks ago. One could actually be concerned that Spain and Italy are around 30-40bps wider than where they were on the Monday morning immediately following the bail-out. So a Trillion Dollar commitment plus ECB buying has yet to make a lasting impact on the epicentre of this crisis. We think it eventually will as the political commitment is extraordinary. However until we see clear signs that the free market wants to buy peripheral debt then the risk is that the package and the European resolve is tested one more time. This would likely bring a fresh bout of market volatility.

Our interpretation of current events is that they are similar to those seen in the corporate credit market back in Autumn 2008. Back then corporate credit became absurdly cheap due to the dramatic collapse of leveraged positions (SIVs being a huge factor). However the market needed several months of these very wide spreads to locate new unlevered buyers to replace the old leveraged buyers. Peripheral Debt today is similar. We need to find investors to take place of those Government bond investors who have now decided that their job is to take interest rate risk and not credit risk. So unless the free market makes this transition quickly, the authorities may soon be forced into more aggressive action. So for us Sovereign spreads are still at the epicentre. Everything else is highly dependant and will respond to this.


Going to search for investors ...

Wednesday, May 26, 2010

Pearls Of Investment Lectures By Benjamin Graham

Thanks to Jason Zweig, read the probably best investment lecture ever here ...

James Montier About To Kill "Cream Lickers" At Efficient Frontiers?

James Montier, the well known expert of behavioural finance and an advocate of value investing, the member of GMO's asset allocation team now, has an excellent "white paper" (available at GMO, registration necessary) "I Want to Break Free, or, Strategic Asset Allocation ≠ Static Asset Allocation".

This paragraph, written by James, may be applicable to the situation in the markets these days, if one believes that equities may lead over credit for a longer time:
Volatility creates opportunity, not risk. As John Maynard Keynes long ago opined, “It is largely the fluctuations which throw up the bargains and the uncertainty due to fluctuations which prevents other people from taking advantage of them.”
However, the flaws of modern portfolio theory are clearly exposed. It should not be difficult to identify the "cream lickers" at efficient frontiers, who fail to handle the reality... Click on chart to enlarge, courtesy of GMO.

Enjoy the note in full!

Tuesday, May 25, 2010

Gaming The Game Theory

William Spaniel has got an excellent compilation of game theory videos on YouTube (H/T FT Alphaville).

Inter-Bank Love

Velocity of money drops very rapidly, if banks do not love each other ... as some parents in form of sovereigns cannot help anymore to solve the dispute.

Click on charts to enlarge, courtesy of Nordea Markets.

Monday, May 24, 2010

Obvious Duty To Report On Klarman

Assuming the warning on this blog at the upper left corner using the words of Seth Klarman, pushes me for an obvious duty to report on the rare appearance in media. There are 3 sentence to quote from Reuters contribution:

"Given the recent run-up, I'd be worried that we'll have another 10 years of zero returns," Klarman, who rarely speaks in public, said at the CFA Institute's annual conference in Boston.

Current market conditions remind Klarman of a Hostess Twinkie snack cake because "everything is being manipulated by the government" and appears "artificial."

"I'm more worried about the world broadly than I've ever been in my whole career," Klarman said.


Here are more links to media appearance:
WSJ: Legendary Investor Is More Worried Than Ever
and more at market folly: Notes From Seth Klarman's CFA Conference Speech

J.P.Morgan Maintains Medium-Term Bullish View On Risky Assets, But Keeps Tactical Risk Low

Here is the latest summary of J.P.Morgan's markets view:
• Asset allocation: Keeping risk tight, we’re avoiding consensus trades where feasible, but not giving up on medium-term bullish view on risky assets.
• Economics: Slightly softer data may unnerve markets but are not enough to change our growth forecasts.
• Fixed income: Bond yields to move higher medium term, but remain hostage to market volatility near term.
• Equities: Position squaring favors Europe, large versus small caps, and defensive versus cyclical sectors in the near term.
• Credit: Flows out of high yield mutual funds have been occurring for three consecutive weeks, pointing to further spread widening near term.
FX: The recovery in commodity currencies looks to be on hold until after G-20.
• Commodities: The medium-term direction is still positive.

Guys at J.P.Morgan have made also a great Q&A session, with some most relevant, in my opinion, questions and answers as follows:

How bad can it get? If we are right that the underlying cyclical rebound remains in place, that banks will not be a source of contagion, and that policymakers will be generally supportive, then risky markets should bottom over the next month or so. But this argument does not tell us how far the knife can fall.

What will stop the sell-off? Three signals are most important: (1) confirmation that the nonfinancial sector—companies and households—are not panicking and remain in expansion mode; (2) coordination among policymakers to support markets rather than punish them; and (3) markets cease reacting to bad news and start reacting to good news, something that was clearly not present this week. One can understand the frustration of policymakers in the midst of renewed market panic, but the only solution for overstretched public balance sheets is growth, and that requires coordinated support to markets.

What to do in the meanwhile? Keeping tactical risk low is obvious. Investors with staying power should start buying oversold assets, though, without being in a hurry. Remaining positions should be focused on non-consensus exposures.

Then, there is a belief that employment will follow the corporate profit growth, as can be seen in the chart below. However, the gap has got extremely large this time, and the question for me is - whether the one is achieved at the expense of other ... and whether this is not exactly the cause of weakness in economy?

Click on chart to enlarge, courtesy of J.P.Morgan.

How long the cyclical upturn remains in place?

Friday, May 21, 2010

China Car Sales Versus Residential Floor Space Sold

While we observe sharp declines in sales of Chinese residential floor space, Citigroup suggests that we should also see the same in car sales?

Click on chart to enlarge, courtesy of Citigroup Global Markets.

Thursday, May 20, 2010

Baltic Dry Index

As Barclays Capital was pointing at on Tuesday, not all signals are bearish. Or, at least, it appears so far...

Click on chart to enlarge, courtesy of Barclays.