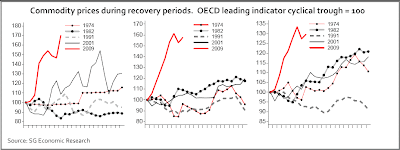
... the latest spike in oil and most other commodity prices has pushed up raw material costs sharply. While certain observers may look at these trends as nothing more than normal cyclical adjustments, this is far from being the case.Charts below, and also the accompanied text, do not specify the commodities under consideration or index, and, very likely, assume the changes in prices for different currencies. The chart on the left side appears to be likely measured in USD, the right one - in EUR. But the assumptions were not confirmed so far...
Monitoring commodity market trends in the light of the position in the economic cycle strongly shows the anomaly of the current recovery in comparison to past ones. There is indeed no example in the past four exits from recession during which commodity prices have inflated so much so soon, even in 1974! Oil prices are now above $80 a barrel, or 75% above their level in April, corresponding to the trough in the OECD leading indicator. This is more than 65% above the average price trend of past recoveries. Interestingly, markets do not seem troubled by such a development.
Click on chart to enlarge, courtesy of Societe Generale.
 This one should just add some curiosity to the recovery story, and should reveal also the self-reinforcing positive feedback loop. Think of momentum trade that loses the support from economic surprise ...
UPDATE: These "Commodity prices" in the charts are "Oil prices" ... a look at DJ UBS Commodity Index Total Return is by far less stellar, look for next post ...
No comments:
Post a Comment