Consumer credit has fallen in each of the past 7 months and 11 of the past 13 months. As a result, consumer credit has declined by $117 billion, or 4.5%. The declines in consumer credit have begun to reduce the ratio of household debt to disposable income from its historic peak of 24.4% at the end of 2004 down to an estimated 22.1% in November 2009. Because disposable income has also begun to increase in H2 2009, this ratio has now fallen slightly below its long term trend, but it remains at a level that exceeds any past business cycle high.Click on charts to enlarge, courtesy of BNP Paribas.
 However, there is one issue that hints to heavy dis-savings by US households in recent months:
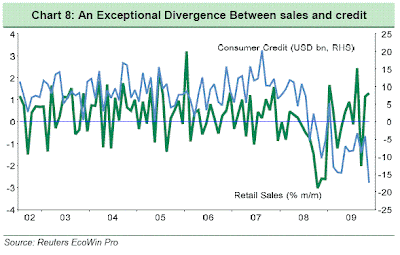
The importance of consumer credit to the economy cannot be stressed enough. Of course too much of a good thing can be fatal but not enough can severely slow down the pace of consumer spending over time. As the last chart reveals the rise and fall of retail sales has been mirrored by the similar changes in consumer credit for nearly the entire period. The major exception has been in the past 6 months when credit has declined and sales have increased. The history of this relationship suggests that sales cannot continue to rise if credit continues to shrink.Click on chart to enlarge, courtesy of BNP Paribas.
 Who can dis-save now? One issue is increase in incomes ... On the other hand, there is an issue with income inequality, that I have been trying to address some time ago.
Steve Randy Waldman at Interfluidity has an excellent compilation of links today, that try to address the role of inequality in macroeconomic stability. It is worth looking at ...
No comments:
Post a Comment